Vince Baumel is a Consultant at Daugherty Business Solutions. Vince noted,
I bring a strong background of academia and industry experience to my career in data research and visualization. I thrive on helping people find meaning in their data and communicate their findings, and I am meticulous about my own work and how it’s presented. I’ve brought a more agile mindset to a traditionally static waterfall work environment, and fostered a new communication paradigm that allows various user teams to interact independently.
In my career I’ve tackled many different aspects of data administration and management, and always enjoy the opportunity to communicate effectively with data. It’s an honor to be able to share the passion and enthusiasm I have for this industry with so many people!
QUESTIONS
Michael: Hello Vince. I really liked your Tableau tricks! workbook that you posted on Tableau Public. It is a real potpourri of a wide range of tricks that can help you in developing your Tableau data visualizations. Can you tell my readers what motivated you to create this workbook and how it can help others in the Tableau community?
Vince: Early in my career I was trying to find an effective way of cataloging all the little tips and techniques I came across. These ideas came from all sorts of different places – blog posts, books, Tableau help forums, Twitter posts, Reddit, LinkedIn, etc. Many of the ideas were ones I came up with as well – either directly work related, or sometimes just playing around and seeing what I could do. I realized one day that I had about 20 different workbooks containing just a single worksheet or dashboard, all using Superstore to demonstrate one thing or another. So I decided to consolidate them all into a single workbook – a journal of sorts, that could serve as both a single point of reference as well as a snapshot of where my skills were at the time. Some of the techniques have been made obsolete as new features have been added to Tableau, but it’s been a really helpful habit that has come in handy time and time again!
One
of the techniques I liked the most from that first Tricks workbook was born out
of a conversation I had about stacked area charts. We were discussing how it
was only reliable in showing the growth of ONE dimension over time; the
dimension grounded on the axis itself. I had just learned about hover actions
in a worksheet, so I built a stacked area chart that showed a %-of-total breakdown
per dimension for the x-axis time you were hovering over. It solved the problem
in a really cool way!
Michael: On your Quantum Relic blog, you had a post where you say, “Done is Better Than Perfect.” If I may, I would like to quote a snippet of your post.
“Nothing you create will ever be perfect, and this is a good thing. Do not seek to outdo yourself with every iteration of every idea that comes to your mind, because you will burn out before you ever arrive at a product you consider “perfect”. This idea, this siren, is (and should be) forever out of reach. Were you to achieve it, that creativity that drives you would slow to a stop. Strive for it, certainly, but maintain a healthy fear of ever actually attaining it.”
So, I really
get this. I think most people in the Tableau community are probably
overachievers, Type A personalities, perfectionists or one of the Flerlage
Brothers (sorry gang, I know I am stereotyping here). But, as part of
our job in data analytics, we are expected to produce data visualizations that
are 100% accurate in their results. How do we find a balance here?
Vince: Great question! I think that in order for us to be effective data analysts (and we’re ALL data analysts in one capacity or another) we need 3 fundamental understandings:
What is the truth of the data?
This speaks to the accuracy you mention, and requires us to know where the data is coming from, what are the limitations of the data, what is being done to correct inaccuracies in the data, etc.
2. What is the perspective of my audience?
This goes deeper than just deciding which filters to add to a dashboard. What keeps your users up at night about their area of the business? What motivates them? Once you can answer these questions your ability to COMMUNICATE to them becomes much more effective.
3. At what point have I answered the question?
This is both the easiest and the hardest one. Sometimes all you need is a bar chart, and that’s okay. Not every visualization has to be a multidimensional correlative bi variate tile grid map (no offense to Leonard Kiefer, your tile grid maps are a thing of beauty), but every visualization should answer a question. At the end of the day a boring viz that perfectly anticipates and answers a question is still a pretty big win in my book.
My blog post is referring to that little voice in
the back of our heads that is always trying to convince us that we’ve got time
for just ONE more little tweak. The reality is that we can get stuck in an
infinite loop of these little tweaks, and we need to recognize when that
pattern is happening.
Michael: I have to ask, what is a Quantum Relic?
Vince: I’ve always wondered if someone would ask me this question, since the day I decided to use it as my Twitter handle! In truth, growing up I was the kid who always had his nose in a book. When I was in my early teens I spent a lot of time reading about philosophy and one idea that really resonated with me was that there is a core part of who we are as individuals that always remains there, deep down, and untouchable. Our interests will change, our motivations will change, our understandings of who we are will change, but there will always be this tiny part of our identity that remains the same. This quantum part of ourselves serves as a relic – a memento of what we get when we distill down all of the other changes we’ve gone through and reveal who we TRULY are underneath it all.
To sum it up, a quantum relic is…quintessence,
really. Raw, undiluted truth.
One of my favorite authors is a man named Steven Pressfield, and his book, The War of Art, speaks to this idea. It’s one I definitely recommend.
Michael: You are a Consultant at Daugherty Business Solutions. Can you talk a little about how you use Tableau in your day-to-day engagements?
Vince: Tableau is an industry leading tool in large part due to its flexibility. Whether your data is a 3×5 cell table your found on Wikipedia or a server farm processing billions of rows of data, Tableau gives you the ability to see and understand things about your data that you just can’t find in other tools. In my work at Daugherty, I use Tableau to bridge the gap between rigid analytics and creative design – I love being able to use the same tool to shape and curate the data, explore and identify patterns and trends, and be able to visualize it in any way I can dream up.
There’s something to be
said for how many of us spend our work days designing visualizations for work
and our free time designing visualizations for ourselves and each other.
One of the
reasons I pursued Daugherty as an employer is because they recognize how
important it is to foster that drive outside of work. Encouraging and
empowering your employees to develop their personal skills, especially in tools
like Tableau, will only serve to make them more valuable to your clients.
Michael: Can you tell us three of your favorite Tableau Desktop tips and tricks?
Vince:
1: The first of these is also the simplest. I spent SO many hours
trying to get my dashboards perfectly aligned (I even taped a ruler to my
monitor a few times) when all I had to do was press the letter G.
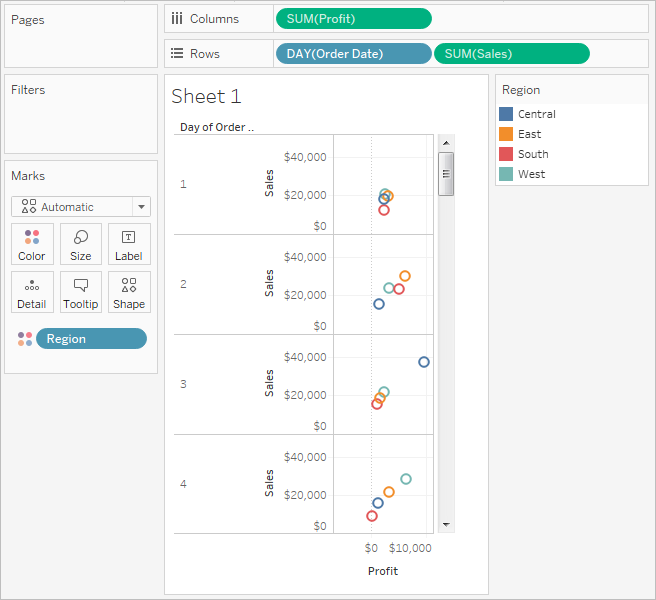
2: Double clicking can do wonderful things in Tableau, but the
ORDER in which you double click also makes a big difference! If you double
click in the following order: Sub-Category, Profit, Sales
You’ll see that Tableau builds a text table, assuming you’re
primarily interested in the subcategory breakdown.
If you double click the same fields in a different order: Sales,
Profit, Sub-Category
Now Tableau assumes you’re more interested in the relationship between Sales and Profit at a sub-category granularity, so it builds a scatter plot instead!
3: I try to stay in the habit of validating my custom calculations
at every step of my development. When calculations get big and complicated, it
really helps to be able to drag portions of the calc onto different places in a
worksheet to make sure everything checks out.
Michael: If you could magically be alone in a room with Francois Ajenstat (photo above), what would you ask him to add into Tableau?
Vince: One of the things that I think has propelled Tableau’s adoption is the freemium business model and what Tableau Public has done to facilitate data fluency. I would love to see that same approach with Tableau Prep, considering how much momentum the product has.
On a more tactical note, I’d love to see improvements in dashboard layer management. I can name several other tools off the top of my head that have very intuitive and flexible control over layers, and it certainly seems possible in a tool like Tableau.
Michael: What is next on your “To Do” list? What can the Tableau community expect to see from you in the near future?
Vince: This year I set a goal for myself to do more public speaking, both through presentations at Tableau User Groups and through my blog. I will continue to be a voice of encouragement and affirmation, and a listening ear for anyone who needs it.
Also I’m hoping to add another certification in the near future
so stay tuned!
Born, raised and currently residing in Belgium; Marian went to culinary school but changed careers when she got her first job in IT support. She’s held several operational roles in Customer Service since then (customer advocate, process specialist, team leader, global process leader); and until recently she was supporting the different teams around the globe by providing intelligence on performance levels and maintaining the organisation’s dashboards in Tableau. Her journey into data visualization and specifically Tableau was an ‘accidental’ one but her interest and fascination with how we visualize information to tell a better story has always been there.
After having attended her first Tableau Conference in London in 2018 she became active in the online community through initiatives like #MakeoverMonday which allowed her to further develop her skills and take the lessons learnt back to work. She recently obtained her first Tableau Certification and is currently working towards taking the Tableau Desktop Qualified Associate (DQA) exam.
Outside of work
Marian enjoys going on culinary adventures and exploring different corners of
the world through the lens of her camera.
Michael: Hello Marian. On Tableau Public, your dataviz for DESI: Digital Economy & Society Index was recently selected as Viz of the Day (VOTD).
Can you tell my
readers the process you went through to develop this data visualization? For
example, how you gathered and prepped the data, created the design, and
translated that into Tableau.
Marian: My ‘DESI’ was actually a late submission for MakeoverMonday. We’d been having some interesting conversations at work on our own “digital readiness“ and when I saw the dataset come out; I knew I had to create something with it and that I wanted to take my time.
I should mention that part of the design was
very much inspired by Erik
Rettman’s viz. It started with me
wanting to see if I could replicate what he had created, and all the other
pieces fell into place as I started building it out in Tableau. I wanted to add
some additional context to help people understand what they were viewing. If
you’re going to create an exploratory viz, I believe it’s important to provide
just the right amount of information (not too much) to help people frame up the
data. So I put in a few additional elements like how the score is calculated
and a short explanation of the different dimensions.
Inspiration for me is something infinite. I
usually get too many ideas then I know what to do with; for this project
however the choice of colours was immediate. I wanted it to be ‘themed’ in
using blue for the EU and yellow for the different member countries but the
colours didn’t really pop on a white background, so I went with a very dark
grey to really make them stand out and draw folks in. The choice of background
meant that I didn’t have too many options to fill in the lines/bars so I went
with a lighter shade of the background colour so you could still see the ‘part
of whole’ but without taking away from the highlights which were meant to be
the focus. You’ll see that all other text is white except for any mention of
the EU or the different countries which was very much a deliberate choice.
With regards to the data-prep, I had some
challenges with using calculations to add the rankings to the individual DESI dimensions,
so I went back and added them to the data-source rather than using
calculations. There are probably better ways to do it but that’s what I went
with at the time.
One of the best reactions I received from folks after having received VOTD was actually when a colleague reached out to me because they had seen my work shown as “Viz of The Week” when they opened Tableau Desktop and they wanted to know more about how I created it. I’m currently putting the finishing touches on a blog post which will released as soon as possible.
Michael: Can you tell us a bit about how you use Tableau on a day-to-day basis in your work?
Marian: I started using Tableau a little under a year ago. We were having conversations at work about how we could operationalize our metrics more. Instead of being re-active and reviewing a table of numbers at the end of the month, the idea was to be more pro-active and start using the data to drive the performance of the teams. I did my homework on BI tools and stumbled onto Tableau. I knew at the time other departments were using it for reporting purposes, so I managed to convince my boss to send me to the Tableau Conference in London to get some training and learn what others were doing; and that’s really where my journey started.
When I look back, the very first dashboard I built (this was before I knew anything about Tableau or dataviz best practices) was just awful, but people were very excited about actually being able to see what’s happening on a daily basis which has been a real game changer. The KPI dashboards I launched have very much changed the conversations the teams are now having. Not only have they changed how we manage the ‘day-to-day’, but we also started having different conversations around making process changes to be able to better fulfill the needs of our customers.
Michael: Can you tell us three of your favourite Tableau Desktop tips and tricks?
Marian: This is always my fav question!
Changing Colours
This is a 2-for-1 and one my favourite tips
to date. You can choose any colour for the different values straight from the
‘Edit Colors’ menu by simply clicking on the square in front of the value. And
it gets even better, you can then drag the sampled colour to your ‘Custom
Colors’ section preserving it for future use.
Information Button
This is the
simplest information button you’ve ever created, and the best part is you won’t
need to mess around with custom shapes.
On the Marks Card
double-click in the blank space at the bottom
Type “i” in the blank pill
Change the mark to ‘Circle’
Change from ‘Detail’ to ‘Label’
Change the size and colour of the circle as you
see fit and adjust the font and colour of the “i” (I used Arial MT Bold in my
example)
And if you really
wanted to get creative, you could consider using ALT CODE
characters or even
some UNICODE
arrows to create
buttons as seen below.
Validating your Table Calculations
Something I picked up during a webinar (and
which has really helped me out several times already) is when you are working
with table calcs. Temporarily change the Mark to ‘Text’ and add totals to your
columns and rows so you can validate the calculations are giving the results
you expected.
Michael: You are a regular participant in #MakeoverMonday. Can you tell my readers how participating has helped develop your Tableau skills?
Marian: I haven’t been as active as I would like to be this year, but I’m am working on getting my groove back. Last year participating in MakeoverMonday really allowed me to practice my Tableau skills and get better insights into what makes a great dataviz. And I got to meet some pretty amazing people along the way.
For me joining the community was a way to
learn from experts (for free!!) and practice, practice, practice. If you want
to become good at something you have to put in the time, and I did pretty
consistently over a period of 6 months … and it paid off. I passed my first
certification exam and was able to elevate the quality of my dashboards at work
up to a point where others started asking me to help them out with their
designs.
Michael: What makes a real Belgian Waffle great?
Marian: Not to make things too complicated but in Belgium there is actually no such thing as a ‘Belgian Waffle’. The 2 main varieties of waffles are called the ‘Liege Waffle’ and the ‘Brussels Waffle’. My favorite is the Liege Waffle and no toppings please, you don’t mess with a good thing. I have very fond memories of getting ready for boarding school on a Sunday afternoon and my mom had just baked a fresh batch for me and my brothers to take with us to school. The secret is in the dough and how well you’ve mixed in the ‘pearled’ sugar (the real thing, none of that DIY stuff please) so that it partly melt into in the dough as the waffles are baking. Don’t eat them when they come straight out of the iron, let them rest for a few minutes so the dough can set and cool off a bit.
Michael: What is next on your “To Do” list? What can the Tableau community expect to see from you in the near future?
Marian: Give back more. More blogging and supporting #VizForSocialGood.
2019
is also a year of trying new things and putting myself out there more so who
knows, perhaps giving a talk at one of the upcoming conferences or user groups.
For much of my career, I have had to travel to New York City (NYC) every few months. I always found NYC to be fascinating in that it is always awake, humming, and vibrant. Also, NYC has some of the most beautiful buildings in the world.
There are over 6,000 high-rise buildings in NYC, 274 of which are skyscrapers standing over 492 ft (150 m) tall. NYC is number two globally for such tall buildings, only behind Hong Kong.
Flatiron Building, New York City
For a period of time, when I worked in New York, I worked in The Empire State Building. Taking a break and having a cup of coffee, I was able to look out the window and see all the way to the new World Trade Center tower. Back when I worked for American Express, our building housed a historical timeline and narrative of what tragically happened on 9/11. There was an observation window for many years where visitors could watch as they carefully sorted through the rubble of the previous Twin Towers.
Empire State Building, New York City
The infographic I am showcasing today is from Liberty Cruise, and it shows the tallest buildings in New York City.
To help you put things in perspective, here is a list, and individual profiles, of the current top ten:
Rank
Building Name
Height
Completion Date
#1
One World Trade Center
1,776 feet (541 m)
2014
#2
432 Park Avenue
1,396 feet (426 m)
2015
#3
30 Hudson Yards
1,268 feet (387 m)
2019
#4
Empire State Building
1,250 feet (381 m)
1931
#5
Bank of America Tower
1,200 feet (366 m)
2009
#6
3 World Trade Center
1,079 feet (329 m)
2018
#7
53W53
1,050 feet (320 m)
2018
#8
Chrysler Building
1,046 feet (319 m)
1930
#9
The New York Times Building
1,046 feet (319 m)
2007
#10
35 Hudson Yards
1,009 feet (308 m)
2018
Two of my favorite buildings, the Chrysler Building and the Empire State Building, were erected during the Great Depression and still crack the top ten list today.
The Chrysler Building was the first skyscraper ever to be built at a height exceeding 1,000 feet. Meanwhile, the Empire State building, which was finished one year later, was the “world’s tallest building” for nearly 40 years.
However, as you review this list, you will see than the rest of the buildings in the top ten were built more recently. It’s a testament to how fast the skyline of New York City has changed even in the last decade.
Towers in the Pipeline
But that’s not all, because the skyscraper boom in NYC hasn’t ended yet. The following megatowers are closing in on completion, and will displace many at the top of the current list:
111 West 57th Street This building is set to be operational in mid-2019, and it’s already very noticeable on the NYC skyline. With a height of 1,428 feet (435 m), it will be the “skinniest” skyscraper in the world when completed, with a width-to-height ratio of 1:23.
Central Park Tower This building, which was designed by the same people who did the Burj Khalifa in Dubai, will be the tallest building in the country by roof-height when done in 2020. It will clock in at 1,550 feet (472 m), making it the most sky-high residential building in the world.
45 Broad Street With a height of 1,200 feet (366 m), this new building in Lower Manhattan is expected to be completed by 2021. If it were finished today, it would tie the Bank of America Tower for the fifth spot on a list of tallest buildings in the city.
One Vanderbilt This massive building will be the fourth tallest in the city when completed in 2021. Standing at 1,401 feet (427 m), it will have a highly anticipated observation deck set 1,000 feet above the ground.
Want to visualize more data about the Big Apple?
Check out this animation, on VisualCapitalist.com, which shows the population pulse of a Manhattan workday.
I wanted to share an interesting data visualization experiment that Susie Lu is doing in her spare time for fun.
Susie
Lu is
a Senior Data Visualization Engineer with Netflix. She has been doing some data
visualization prototypes with grocery receipts.
The
grocery receipts are made with thermal printing; no ink is used. The prototypes
were created by connecting a printer via USB to her computer. The printing
protocol was made accessible to her in JavaScript with a
thermal print design created by Sam Saccone.
Here
are some screenshots of some of her prototype testing.
I think Susie’s experiment is very creative and something for all of us to think about in how we can visualize common things like grocery receipts.
Well, I finally added all those blogs I have been saving to my list. I have changed the name of this list to include Data Analytics to better reflect the theme of many of these blogs.
In the screenshot below, you can see how to get to this page from my DataVizBlog homepage or you can use the link below.
If you have a data analytics or data visualization blog and don’t see it included in my list, please drop me an e-mail at tableau@cox.net and provide me your name, site name, site link and RSS Feed (if you have one). I will add you to the list.
In Professional life, I am Health Economist PhD, Health Systems Researcher.
Quit Academia Career after 15 years.
I have a passion of data visualization and keen to improve healthcare through the power of analytics. I am a highly qualified researcher with proven analytical and communication skills who found true passion in creative and logical problem solving by using data. In my work as a health economist I have extensive experience working multiple databases. My research interests cover: – health care systems performance (financing, resources allocation, equity, efficiency), – complexity of health systems, – public and private sector in healthcare, – cost of illness studies.
Michael: Hello Anna.
On Tableau Public, your recently posted your IronViz entry, Coal
Plants Make Europe Sick.
Can you tell my readers the process you went through to develop this data visualization? For example, how you gathered and prepped the data, created the design, and translated that into Tableau?
Anna: My goal for this year was to submit a feeder for IronViz Contest. When I first saw the contest topic Energy & Sustainability a few ideas popped up in my head. I knew from the very beginning that I want to connect somehow this topic with healthcare data. After quick research I found this fantastic Report and database prepared by Europe Beyond Coal organization (https://beyond-coal.eu/). I decided to create an interactive dashboard showing off the damaging impact of coal plants on our health. I used Tableau Prep for data cleansing. The goal was to keep it simple both in charts and colours, so I have chosen interactive map, bar charts and scatterplots. For colours it was just white, grey, black and orange to put more emphasize on the key facts. To make dashboard more interactive I was motivated to learn set actions from Lindsay Poulter blog (http://www.lindseypoulter.com/). My dashboard consists of three main parts: (1) Background and Context: with interactive map and some information about coal plants in Europe; (2) Analysis: a few metrics showing the impact of each coal plant on health (3) Recommendations: what should be done on plants and governments level to reduce the damaging impact of health. I wasn’t sure whether the dashboard meets IronViz criteria, so I asked Sarah Bartlett (@sarahlovesdata) and Lindsay Betzendahl (@ZenDollData) for their opinions. They provided me with a great feedback and encouraged to publish it and submit it. I was really excited to see my viz in the Top 3 Europe Iron Viz submissions as I would never expect it.
Michael: You are a Research and Data Visualization (Tableau) Freelance Consultant primarily working remotely. Can you talk a little about how you can help businesses in their data visualization needs using Tableau?
Anna: Hahaha! Yes, this is the information that I have put on my Linkedin Profile. Nevertheless, the fact is that I am currently on my annual maternity leave. I decided to make most of this this time to learn some new skills, that would help me to boost my career and ultimately change its path. Once my Tableau Public Profile became more attractive, I immediately started to receive multiple job offers within data viz field. Since working remotely was my only option I included this information within my Linkedin Profile. This part of my professional experience is mainly providing feedback to other Tableau users on created dashboards and help to learn data viz. All this contribution together with new data viz skills helped me to get a new job as Health System Researcher. I start my new assignment in July right after my maternity leave. I am very excited leaving Academia career after almost 15 years and looking forward to working in totally different environment.
Michael: Can you tell us three of your favourite
Tableau Desktop tips and tricks?
Michael: Back in January, you had the
VOTD and VOTW for your Chain of Death in Connecticut data
visualization. Can you tell us your thoughts on how we can help reduce the
number of drug overdose-related deaths, and specifically, the opioid epidemic?
Anna: It was really difficult and challenging dataset as it was dedicated to my younger brother Peter, I lost three years ago. The problem of opioids is very complicated and multi-dimensional. We see the problem is growing and more and more young people is losing their life. It’s a tragedy for their families and friends. As community we should use impactful dashboards to inform society about problem of opioids and depression. The magnitude, severity, and chronic nature of the opioid epidemic is of serious concern to clinicians, the government, the general public, and many others. Some time ago I read article about rising trend of opioid prescriptions and clinicians acting like “drug dealers” (https://www.cincinnati.com/story/news/2019/04/17/opioid-pain-pill-federal-prescription-bust/3482202002/) In my opinion, we should take further steps to reduce access to opioids.
Michael: If you could magically be alone in a room with Francois Ajenstat, what would you ask him to add into Tableau Desktop?
Anna: Tableau Desktop is such fantastic
tool with so many possibilities which I am still learning. If there would be
anything that I could add or change it would probably be dashboard formatting,
which is very time consuming for me. It would be great to have copy paste
options for annotations, text boxes, divider lines
Michael: What is next on your “To Do”
list? What can the Tableau community expect to see from you in the near future?
Anna: In June I will be on the big Stage of the European IronViz so this is my next big challenge. After the contest I plan to engage even more in Tableau User Groups starting from Warsaw TUG and HealthTUG
I still want to take active part in Tableau Community challenges, especially #ProjectHealthViz, #IronQuest and #MakeoverMonday. I plan to pass my DQA Exam by the end of the year.
Artist/Painter, Logo/Poster Designer, Optimist, Pragmatist, Nature admirer, loves to cook, experiment science and listening to music.
In Professional life, I am working as a Senior Consultant with Beinex, India. I always had a passion about Data Visualization, where one was able to explain a concept by means of visuals which makes it easier for the audience to understand about that particular concept. (It doesn’t matter whether they have already aware of the concept or not)
I started my career in an IT organisation, where I got a
chance to learn Tableau. Then, I realized the power of Tableau in Data
Visualisation. I tried to explore more about the Tableau by creating different
types of charts (sankey, waffle, network charts), etc.
I frequently participate in #MakeoverMonday Project by Andy Kriebel(@VizWizBI) and Eva Murray(@TriMyData) which
helps me to shape up my data analysis and data vizualisation skills. (I was lucky enough to get a swag (water bottle)
from #MoM for 1000th submission, which gave me a lifetime memento) https://twitter.com/VizWizBI/status/1090659140765208576
I just always wanted to explore my design and artistic skills with data visualization and it worked out most of the time. Also, I get constant support and appreciation from the Tableau Community which really cheered me to do more and more. I want to take this chance to thank #Datafam who supports me all the time.
Michael: Hello Pradeep. You recently posted your IronViz 2019 submission on Tableau Public. It is titled U.S. Farms and Farmers Under Threat.
Can you tell my
readers the process you went through to develop this data visualization? For
example, how you gathered and prepped the data, created the design, and
translated that into Tableau?
Pradeep: I still remember the time when I was doing my first Iron Viz 2018 (Water Feeder). That time I was absolutely new to Tableau and I just thought of giving it a try. I just downloaded the data from public government site and created visualization about Monsoon patterns in India
Luckily, I made it to the Top
10 (7th position) and also, I got feedback (from
judges) mail which helped me to correct my mistakes regarding design, analysis
and storytelling.
Since then, I was badly waiting for #IronViz 2019 to participate. I was happy to see the topic is about ‘Agriculture’, but I was a little bit worried to know that we have to use only the provided dataset by the U.S. Department of Agriculture. I have just gone through the dataset, it was huge and confusing at the same time. I have decided that, however complex the data may be, I don’t wanna give up for that reason.
Instead, it gave me a motivation to participate. Then
I just took a while to understand the given data. I thought of concentrating on
5 major challenges from the given dataset. Then I selected those particular
measures and ignored the other ones. (I
used Excel for data preparation)
I wanted to create a simple but effective design.
My only aim was to highlight those 5 challenges in a simple way that anyone who
sees the viz could understand it at ease. I added some key points and visuals (waffle,
donut charts) beside each challenge which would make the audience to relate them
with the problems. I have used 5 color codes (magenta, blue, green, orange and
purple); each color for each problem that would help audience to have a clear
and separated view on each problem. At the bottom, I have added “What can we
do?” part giving my suggestions to overcome from the mentioned challenges.
I always remember the feedback (Iron Viz 2018) in my mind, and I have implemented them in this year’s #IronViz submission. Also, I wanna thank the Flerlage brothers (Kevin Flerlage @FlerlageKevand Ken Flerlage @flerlagekr) who have helped me a lot by giving me constant feedback and support which shaped my viz into a wonderful one.
Michael: You are a Senior Consultant
at Beinex. Can you talk a
little about how you can help businesses in their data visualization needs
using Tableau?
Pradeep: I have recently joined Beinex as a Senior Consultant and I feel really great working with Beinex team to help people understand data.
We emphasize on self-service analytics. We take
business users on an adoption journey to ensure they know how easy it is to
conduct analytics using Tableau. We focus on understanding the requirements of
the business, creating multiple prototypes and suggesting industry best
practices with respect to KPI measurement and visualization techniques.
We have techno-functional Consultants in the team who
have industry experience to guide clients in achieving their analytics
objectives. At Beinex, I have got opportunity to work with client C-suite level
directly and see how data visualization solutions helping them to solve many
business problems.
Michael: Can you tell us three of your favorite Tableau Desktop tips and tricks?
Pradeep:
“No Polygons” by Kevin Flerlage(@FlerlageKev) was one of my favorite
tricks.
Inspired by his work, I have tried
creating my version of “Four Leaf Clover Chart”
following the same technique.
2. “Color Theming in Tableau” by Ken Flerlage(@flerlagekr)
Inspired
by his work, I have come up achieving the same trick using single sheet and
parameter in my viz “Elevated Measles Risk”, a #ProjectHealthViz (Topic- Measles) by Lindsay Betzendahl(@ZenDollData)
Michael: Back in December of last year,
you published a data visualization titled How Americans plan to quit smoking in 2019?
I think the use of burning cigarettes (including the ash) as your horizontal
bars is very creative. Can you tell my readers how you created the cigarette
horizontal bars?
Pradeep:
Yes, I still remember the time when I have created the viz related to smoking
issue. Last December 2018, I have read an article in Insider.com
about “How
Americans plan to quit smoking in 2019?”. This topic really attracted me and I just wanted to convey this topic
in an interesting way using Tableau. So, I decided to use cigarettes as bars.
It
was really fun creating this viz and it was simple to create, as well. As most
of the tableau people knows that we can add an image/shape at the end of the
bar using dual axis. I used the same trick. I made white horizontal bar chart
and added cigarette ash (shape) at the end of each bar. I created the ‘cigar
end’ (shape) for bars in a separate sheet and then I just placed both the
sheets side by side inside a container
So,
a cigarette bar has three parts (Cigar end, horizontal white bar and ash
shape)
I also used transparent sheet trick, background image, added info about “Reasons to Quit Smoking” which would add more flavor to the overall viz.
Michael: If you could magically be alone in a room with Francois Ajenstat, what would you ask him to add into Tableau Desktop?
Pradeep: Tableau is one of the most fast-growing data visualization tools in the market. It is the best way to change or transform the raw set of data into an easily understandable format by powerful visualizations.
I love using Tableau all day
because of its flexibility and stunning visuals.
If I had a chance to meet Francois
Ajenstat, I would ask him to add few things in Tableau Desktop which are as
follows:
Adding charts like Sankey, Radar,
Gauge/Speedometer, Waffle chart types in “Show me” tab by
default.
Adding an option to rotate (Slightly to left
or right) the sheets in dashboard.
Adding an option to
remove all the grid lines/ axes rulers at once, that will save a lot of time.
Tooltip enhancements
like changing tooltip background color.
Michael: What is next on your “To Do”
list? What can the Tableau community expect to see from you in the near future?
Pradeep: I have 4 things in my ‘to
do’ list:
I’m eagerly waiting for the #IronViz 2019 feeder 1 results and I wish my viz to be featured at least in top 10.
Participate regularly in #MakeOverMonday, #ProjectHealthViz and #WorkoutWednesday to develop my data analysis and visualization skills.
I wish my viz to get featured
in Viz of the day #VOTD by Tableau Public.
To complete ‘Tableau Desktop
Specialist’ certification by the end of this year.
It happened again this week. I have internal business partners who are eager to move from tools like Excel, Power BI, and SSRS to Tableau Desktop. But, again, I would have a hard time doing so because the functionality they need is not currently natively supported by your product.
What they want is the ability to create a text (or grid) report in Tableau (interactive or exported) that has headers and footers including page numbers (e.g., Page 1 of 12), page breaks before or after a particular subsection (or collapsible subsections interactively), dynamically show the name of the dimension in the sub-total or grand total row name (e.g., Budget & Finance Department Total), and also be able to print this report pixel-perfect as a PDF.
And I need to be able to do this seamlessly as part of the functionality of the product!
This is not something new I am bringing up. If you do a Google search on “Tableau page break on subsections,” you will see dozens of people trying to find the Holy Grail answer of how to do this in Tableau. These questions have been floating around the Tableau community for over 6 years! Many people over the years have offered workarounds that kinda help, but don’t really completely solve this problem. There are many different Ideas that have been opened on the Tableau Forum. Some date back to version 7.0 of Tableau Desktop.
I know a lot of Tableau purists may argue that we should just use Excel or SSRS to do what I am asking, but that really does not solve the issue. Many of us have been chosen to champion Tableau in our business community. Telling our business partners to go use another tool does not help us bring people into our internal Tableau communities. For you folks that sell Tableau Desktop licenses and consulting services for a living, this is a great opportunity for you to increase the number of licenses and consulting engagements you sell. If this capability existed today, I could increase the number of licenses we have purchased internally fourfold.
In the interim, I have been doing all kinds of tricks and gyrations to have Tableau create business reports such as Financial Reports, Budget Reports, Procurement Reports, etc. Some of these gyrations include creating the report sections in Tableau, and then merging them together, adding page numbers and other information in the footers, etc. using Adobe Acrobat. I should not have to use two tools to achieve what was something I was able to do simply in my old MicroStrategy and Cognos days in one tool.
I realize your focus is great data visualization, data mining, and the ability to do deeper analytics. But, until I can bring people into the Tableau fold first, I cannot do this. I realize bringing in these non-data visualization features goes against the grain of what Tableau’s primary mission is. But, you faced controversy before when you incorporated pie charts into version 9.0 of Tableau Desktop. Granted many people were critical of you doing this (see Stephen Few review of Tableau Desktop v9.0), but it turned out for the best, it probably brought in clients you might have not been able to otherwise, and people have even used pie charts as marks on their spatial maps.
I have discussed this with other leaders in large Fortune 100 companies. They have these same pain points in their organizations too. They say the same thing I say: If I was able to get their current Excel, SSRS, Power BI reports over into Tableau, then I would be able to begin showing them the benefits of using data visualizations for interactive dashboards, infographics, data mining, trend analysis, year-over-year growth, etc. But, if I cannot bring them over to Tableau, I am stuck. They end up creating key business reports in Excel to show senior leadership. When budget time rolls around and I ask for additional money to purchase more Tableau licenses, they say, “Well, it looks like you are doing fine using Excel. And Tableau does not support some of the functionality needed. Why do you need to buy more Tableau licenses?”
So, the ball is in your court. You are leaving many of us behind, who are loyal diehard believers in Tableau, who could otherwise be growing our Tableau initiatives with a few additions to the product. Not every organization needs to create beautiful data visualizations from day one. We need to be able to crawl before we can walk. But once we can walk, baby, we will really start running.
Please help us, Tableau Software. You are our only hope.
Michael: Hello Martin. I love the cartoons you post on
Twitter. Can you tell my readers a little bit about The 100 Day Project?
Martin: Hi Michael. Thanks for having me. Thanks for the compliment. That I am doing the project was a bit of an accident. I sketched cartoons for an article Alli Torban (@AlliTorban) worked on. After seeing early drafts she encouraged me to try it. It’s been challenging at first to post a cartoon every day. But feedback has been great and I am starting to get the hang of it. By the way the article was later featured on the Tableau.com page. Here is a link to it: https://www.tableau.com/about/blog/2019/5/critiquing-data-visualizations-channel-empathy-and-be-productive
Michael: In you post on Medium.com, Topics in Dataviz: A Primer for Getting Started, you state:
Foundation
Know thy data …. and own the story you can tell with it.
Data is the material we have at our
disposal. Knowing the data is a vital part of determining which story you can
tell. A good question to ask yourself is whether you know the system the data
describes well enough to detect odd trends or errors.
Martin: Sure thing. There is this saying that data is the new oil, and I kind of agree with that, but then again it’s not really oil. You can turn oil into a lot of things, if you know the chemistry, but data will only let you do so much. On the other end of that of course is “If you torture the data long enough, it will confess to anything” from How to Lie with Statistics.
Data is the new oil.
If you got into Dataviz to communicate insights, you don’t want to go there. The funny thing about the Dataviz community is that we are all amateurs. So people are very open to helping each other out, because we all started somewhere else. If you need help with data that you don’t know enough about, the best you can do is ask somebody that may know more about it then you.
If you torture the data long enough, it will confess to anything.
How to Lie with Statistics
Michael: In your post on towardsdatascience.com, Data Visualization Sketch — US Supreme Court, you discuss the process you followed to create the data visualization for this. Can you discuss your typical process in creating a data visualization in some detail for my readers?
Martin: Ah yessss. Looking back I am a bit embarrassed about these early posts. I would say my process was pretty decent but my technique wasn’t very good. When I did these plots I had almost a week of d3.js under my belt and had only heard about observablehq.com
But everything considered they turned out OK. I would say I usually approach a visualization from one of two directions. Data or Story. The first is usually more fun. You get to see what is in the data and see what works and what won’t. The second is a bit of a scavenger hunt and jigsaw thing.
What is central to both
approaches for me is sketching. When I have a pen in my hand the work feels
more real, less abstract. I grew up in a house filled with sketches in the
design thinking style my Dad made when he worked on a project. I am glad some
of that rubbed of on me.
I would say after that it’s all
about figuring out which step feels right. Sometimes I go into color and then
to metaphor encoding, or start with lettering. As funny as it sounds sometimes the
data tells you want you should do next.
Michael: I am curious, what is
your day job?
Martin: I am involved in the Human Brain Project, one of the European Flagship programs. It’s an interesting place. Like Dataviz it is very interdisciplinary and a great place to grow. I started out as a neuroscientist. I did a tour or two in Neuroinformatics and data curation, then ended up in Project Management. My team and I are focusing on quantitative quality control. Which is a fun challenge in itself. But when you add research and infrastructure building on top it adds a couple of twists and turns.
Michael: What is next on your
“To Do” list? What can the data visualization community expect to see from you
in the near future?
Martin: To be honest, I am not sure. I have spending the last 3 months in Data Visualization Society slack channels. I am still trying to cope with the experience of having every aspect of Dataviz a channel away. I started collaborations with people I always wanted to work with. Some of this takes time to gel, but I see first signs of some maturing from project sketches to something to lean on. I’d say expect me to continue to take on more than I should, and pull off something neat every now and then.
Here are a few of Martin’s
The 100 Day Project Posts
Sam Parsons is only one year into his Tableau journey and has been working as a Senior Data Visualisation Developer for Dyson for the last 6 months; which is his first Tableau specific job.
He lives near the Georgian City of Bath in the UK and is a proud father of three beautiful children; all under 7, and his wife has been hugely supportive and understanding of the new Tableau career; which takes up so many of Sam’s evenings after the kids have gone to bed.
Sam is an active member of the Tableau community and has recently participated in #IronViz for the first time, finishing 2nd in the Global Feeder 1 – Agriculture. He has three #VOTDs, with two of those coming from vizzing data from the sport of Rugby Union; which has now been demoted to 2nd in Sam’s list of passions, after Tableau!
Michael: Hello Sam. You recently posted your IronViz 2019 submission on Tableau Public. It is titled Sowing Seeds in America. [NOTE: These questions were submitted to Sam prior to him being selected as second place in the Global IronViz Feeder 1 – Agriculture].
I think it is
incredibly well done and is beautiful to view.
Can you tell my readers the process you
went through to develop this data visualization? For example, how you gathered
and prepped the data, created the design, and translated that into Tableau?
Sam: Thank you! This was a hard project to put together. It has been well documented that this feeder for the IronViz competition was difficult for so many, due to the size and nature of the data set. It was the first time, I believe, that Tableau provided the data and didn’t allow any additional data sets to be used to supplement it. This for me was brilliant, because I haven’t yet found a method for finding my own data sets successfully – I think that is a skill in its own right!
The creation of this viz actually started with the European IronViz from this year. I learned a lot through trying to put together a viz for that competition, which ultimately I failed to complete. With the European IronViz, I spent far too long working on developing a ‘story’, ‘flow’ within that viz and then a huge amount of time designing composition. That composition design was done using paper and pens, drawing out ideas, concepts and refining the design. After which I had left myself too little time to find the data I needed and produce the charts and narrative. The data I found ultimately caused me to stop that viz. Why? Well, the subject was Renewable and Sustainable Energy and all the data I was coming across was from research journals that were heavily caveat-ed and I ultimately didn’t feel qualified to represent the data well.
That failure, was great for learning how
I should approach a project such as IronViz.
So for the Agricultural Feeder competition, I was actually buoyed when they announced the data was provided! Great! I thought that saves me time trying to find my own data, I can now concentrate on the Design, Composition and Story!
Early on a few members of the community posted on Twitter about how they had restructured the data using Alteryx workflows. Combining all the individual data tables into one data set and then pivoted the many columns of individual metrics into a long-form data set; better suited for loading into Tableau. One of the first to do this was Sean Miller, who I’m proud to call my #datafam (even though I’ve never met him!), I took Sean’s reworked data set and then started to explore the data in Tableau (Sean was credited for this at the bottom of my IronViz entry).
So where to start with this viz? I have a theory with #IronViz that those
vizzes that create flow and a story the reader can follow naturally, tend to do
really well. With this in mind I wanted
to create a long-form viz, one that the reader can follow the story easily from
top to bottom. Others like to use multiple pages of single-screen views, much
like a book. I personally don’t feel
these work, the interactivity and loading times for each page detract from the
user experience. You can be moving
through the pages following the story, but if you want to re-cap on something
earlier or look again at a previous page that could be related, it’s arduous to
do so. It’s far easier if you quickly
scroll back up on the same page without inducing any loading times. It’s even worse if your pages are larger than
a single screen view, then you have scroll around and switch pages!
So that’s that. Then, I had decided on a long-form viz and I decided to keep the size of the viz so the width was small enough to fit on a generic laptop (1600px). Again the advantage is that the user only has to scroll up and down to follow the story and insight. There was no scrolling side-to-side. Now, I get most people would interact with the viz on a phone, but I was gambling the judges would be using a laptop to work from. On a phone the viz is still small enough across not to cause an real issues, especially if the viz is viewed using Kevin Flerlage’s tip of adding “:showVizHome=no” to the viz URL; which makes the viz fit to the viewers device.
I mentioned before, that part of my European IronViz failure was due to spending too much time on design and planning of that viz. I was determined not to make the same mistakes here, so I set straight away to delving into the data. I played around with the data sets searching for little nuggets that could form the basis of my IronViz entry, and I found plenty. I actually produced an exploratory dashboard, which used a similar method to Lindsey Poulter’s viz of Age Comparisons of NBA Teams, which allows the user to select and open up the underlying detail.
Lindsay’s Viz
So for this, I was using Average Crop Usage at State level and selecting to find the individual counties. This fed a basic map and some bar charts, but was perfect for exploring the data.
The only issue was the interesting data
stories I found were isolated to single states or counties. I wanted to find an angle that covered the
whole of the country, something that had greater depth and would fit my plan of
a long-form flowing viz.
Part of my personal goals for 2019 is to learn Mapbox. I have been spending a lot of my spare time learning how to manipulate Mapbox and get better with setting up base maps as I want them. The IronViz data set lent itself very nicely to being visualized with maps, which then prompted the idea of rather than try and find a particular story within the data to talk about from the beginning of the viz, why not just represent the data itself and explain how the data can differ across the country.
Within the data set there was a variety of data from Fruit / Orchards, Livestock, Vegetables and a few varieties of Crop. I decided (rightly or wrongly) there was likely to be more regional variations with growing of crops, considering the topography and the impact of regional weather. I started by creating a simple Choropleth map, using Total Cropland as a percent of farms acreage, which I took to mean what percentage of farms are used for cropland. When I created this map, I could clearly see there was a weighting of Cropland from the middle of America to the East Coast. Now, I don’t know America very well; I have never been there, I would struggle to tell you where all the states are. I certainly couldn’t tell you about the geography of America. So I found this distribution of crops interesting. I moved on and continued to import my Mapbox base map, to try and make something a little more attractive than the standard Tableau maps we all see regularly. When doing so, my Choropleth hid most of my beautiful Mapbox base I had painstakingly created. Well that wouldn’t do! So I thought, could I make my Choropleth a little opaque? Would that help? I moved the Opacity slider in Tableau and EUREKA! What was this!? I could see the Rocky’s coming through down the left hand side of America right where the least concentration of cropland was showing on the Choropleth! Amazing!
(People living in America will be
saying, yeah so what?) For me, this was
great because I had found my angle, my unique selling point for this viz. I could give context to the data for all
those readers that, like me, did not know the geography of America well. This is the perfect starting point to my viz!
So with that found I quickly moved to my
pen and paper! I VERY roughly (I was
excited, I wanted to get back to Tableau!) sketched out a how I could make a
story from this, that readers like me could follow the data through.
I quickly formulated a plan:
Top
of the viz: Set the Context – how does the density
of cropland varies across America and how does the topography of the Rocky
Mountains and other ranges impact the ability to grow crops in certain states?
Middle
of the viz: Explore how the states vary and crops are
grown through all counties.
Bottom of the viz: Individual states detail, which crops are grown in each state, moving back to are there regional favouritism (which crop has the highest percentage of farm land for each county) of certain crops? e.g., are crops like wheat favorited in one area of the country?
I had decided that I was going to use
Mapbox as the basis of my first map, so there was going to be a more natural
feel to this viz. That meant to me that
producing a viz full of icons in an infographic kind of way probably wouldn’t
fit. Again I leveraged my European
IronViz failure, which I had used photographs as background images, which
section titles and text detail overlaid on them.
(A small section of my European IronViz entry)
I felt this kind of imagery would work
nicely with a Mapbox based map. I looked
through a number of different websites to try and find good imagery for agriculture
and I spend a long time trying to find an image that would work across the top
of the viz and also contained earthly colours that I could use across the rest
of the viz composition.
When I settled on the image of the barn – which had great space in the sky to add a title or sub-text, I then took colours from that to use elsewhere. The blue-grey roof, was used on the Mapbox colouring of the mountain ranges and some sub-text. The red-brown walls, was initially used as the background colour for the whole viz, until I decided to change that to a shade of green that was close to the grass in the picture. The red-brown was then used for some of the main text and rectangular enclosures on the first map.
I then moved on to create the middle section of the viz. I won’t go into the details of that here, I have already touched upon that in a guest blog post for Kevin Flerlage. As I mention before, when discovering the data and its insights I had set up a state-by-state worksheet that allowed the user to find the distribution of the counties through interaction – selecting the state average to display the individual county results for that state. The plan was to use this in the middle section, because I loved the interaction that gave the reader. The problem being was space. There was little of it, due to my choice of dashboard size (width only 1600px), there were 50 states to show and I also wanted to leave room for a Country map that the user could see changing as they interacted with the state multiples. The other issue was Texas! I was cursing Texas when I got to this section, because I had spent a few days, trying to perfect the interactivity, small multiples and bee-swarm charts that were revealed after interaction. Texas has over 250 counties! To display these as a bee-swarm in a space the size of your thumb is impossible! So, I knew the chart this cried out for, it was a Violin Plot – A Box ’n’ whiskers could have also don’t the job – but that is not as sexy and can actually be hard to read sometimes. So I decided I needed to create Violin Plots. I have never created them before, so a quick google search revealed only a couple of tutorials of people using them in Tableau. Luckily for me Gwilym Lockwood had a very detailed tutorial. I worked through his tutorial the best I could – it didn’t all work, but I got it to work enough for what I needed. These Violin plots we made to be subtle to give just enough of an impression to the reader what was happening within a state and how counties were distributed. This was perfect, because it added interest to help prompt the user to interact. They see a different Violin profile and they want to click and see what that does to the map.
At first I had the map next to the small multiple Violin charts changing to a single state view when selected, but I felt this effectively stopped the flow of the story. You select a state plot, the map changes to that state and then what? Nothing. There is no further flow to the bottom half of the viz. So I came up with the concept of trying to link the middle section and the bottom section through visually guiding the reader with lines. You select your state, the country map stays on country, but highlights that state – so again geographically you can see where you are selecting (especially important if you are not from the USA). This in turn sets off highlighting of a couple of line sheets. The first, what I call Croplines, polygon lines created to draw the eye down from the map, and then visually to come out at the reader, taking the space horizontally under the violin plots, this was intended to look like a field that had been drilled. I wanted to use a flash of yellow, as that linked to my colour of crops in the maps, but also really popped out from the background. These lines were great, but they ended in a flat, unattractive bottom horizontal line. I didn’t like it, it needed visually to be broken up and the line to be finished off. So I decided to add a bar chart that drop down from the flat edge of the Croplines. This was perfect for breaking that harsh edge up. The intention was for this bar chart to be changeable in its metric, the same applied to the violin plots and the map above the Croplines. I wanted to be able to choose an individual crop type, to really increase the interactivity. Sadly, that had to be scrapped. It was too intensive on Tableau, there was too much data and it took an age for Tableau to respond to the user interactions. So I had to compromise that added interaction for the greater good – the reader’s usability and experience interactivity. I wasn’t finished there though I still needed to make that link to the State map, the flow needed to continue, so I introduced thin and subtle curved lines that lined up with the Dropbar chart and the lines at the other end all drew together and met at the State map. These lines also highlighted the same as the Croplines and the Dropbar Chart. I was really pleased with the effect this had within the viz and it almost gave the viz a showpiece element. The interaction at on the violin plots lead the user to follow the flash of yellow line down through to the State map.
Which leads us to the bottom of the viz and last design elements. So we have given context at the beginning and some interactive detail in the middle of the viz, now I needed to provide greater detail for the reader to discover more insights about the data. I did this through listing the different crop types, and showing via a Treemap / bar chart which crops an individual state preferred to grow. Interaction allowed the user to dive into county level as well. The last element was another Mapbox map that was controlled via the crop types by the Treemap / bar chart. That map was given circles, one per county, and each circle represented a single crop type – the county’s most preferred crop (e.g., the crop they devoted the most percentage area of their farms). On selecting a crop type the map to the right would filter to only show those counties that had that crop type as their preferred crop. This was intended to help the reader find further stories around regional crop preferences and to supplement this, I provided links to the IronViz data and some weather data, and encouraged users to continue the discovery.
I finished the viz off with another
photograph, which I felt helped balance the viz as a whole, with the photo at
the top. I played around with the
colours a little, introducing a graduated background going light green to dark,
this was to help with the visual flow from top to bottom, but it’s a more
subtle cue to the reader. Much of the
text and labels were written at the last point and if I had more time I would
have devoted a little more time on those narratives.
I’m really proud of this IronViz entry
because my goal in entering the competition, was not to be on stage at TC19, but
rather test myself against a community I look up to so much. I have been working with Tableau for a year
on and off, and been active in the community as well. Yet, I didn’t really know where I fitted in
terms of my skill levels. How good am
I? So, I wanted to use IronViz as a
testing ground to find out. This is
partly the reason I did not pass my viz through other people asking for
feedback before publishing, or asking for help with difficult elements such as
Violin plots. I wanted to test myself and
produce something that is my own. I was
stunned with the result and totally over the moon. It’s been a great process to go through and
so far hugely rewarding.
Michael: Can you tell my readers how your Tableau journey began?
Sam: Ah man, this is a fun question for me. I’ve actually come full circle with my career. Tableau has given me an opportunity to reconnect with a side of me that I thought was lost and never coming back.. Sounds cryptic right!? Let me explain. I grew up loving Art. I was always drawing as a kid, I loved it, I had a flair for it. I went to University and studied Product Design and Manufacturing – essentially a Design degree ran from the Engineering Department. Due to the intense engineering nature of the degree I found a lot of the exams tough – I was someone that loved to draw, trying to muddle their way through thermodynamic, fluid equations and much, much more. While my design excelled, some of my other exams didn’t. I finished University, lost a little confidence in my own ability and fell into work for the National Trust – conservation Charity in the UK. I worked for 14 years within Finance and became a Business Analyst. I had a flair for Excel, I guess the logic of it fitted with my engineering background! And then last year the National Trust brought in Tableau as it’s preferred reporting solution.
They linked up with The Data School in London and Joe Macari joined up from the School to deliver our training. He was the one that introduced me to the Tableau community and he stressed the need to get involved online, on Twitter, on Tableau Public and participate with #MakeoverMonday. I loved the look of Tableau immediately and I was sold! I tried to embrace learning Tableau and joining in on Twitter – which at first was quite alien to me. Who was going to care what I was posting!? Is there a point to me doing it? I had those doubts, but I stuck with it, I tried to strike up conversations with others and join in. It turns out that was the best piece of advice I think I had been given in my career to date!
I posted my first viz in March 18 and by May 18 I had my first Viz of the Day (VOTD)!
Sadly though, even with the training sessions Joe delivered. I wasn’t able to use Tableau in my day job, I had Excel work that was too critical to stop doing. So I took to learning and developing my skills at home in the evenings. I posted my first viz in March 18 and by May 18 I had my first Viz of the Day (VOTD)! I was a bit of a gift, its one of the simplest VOTD’s you will see, but it was from #MakeoverMonday and about The World’s Most Expensive Prime Property – how many square feet could you afford in different cities around the world for $100M. That though, was the kick that made me think, maybe I can do this and be good at it?
I then didn’t use Tableau for another 3 months! Work got crazy, pressure was great, I didn’t have time to do anymore. It was a great frustration to me, because I found a new tool I loved, it allowed me to have fun and be creative, but I didn’t have time to use it! So the decision was made, I needed to leave to find a job that allowed me to use Tableau on a daily basis, I couldn’t see the end in my current role at the National Trust. So in August 2018, I set to producing a few more vizzes to increase my online profile. Luckily another one of those was VOTD – where I sourced my own data and visualized The Rugby Union English Premiership League History.
Rugby is a passion of mine, so this was a lot of fun to put together – I look back now and think I would change so much! I had only half finished that Rugby Union viz when I applied for my first Tableau role, I applied to Dyson for the role of Senior Data Visualisation Developer. I very nearly didn’t because I felt I was really pushing the boundaries of what I could achieve. Let’s not forget I applied for this 6 months after I published my first viz to Tableau Public, but in those 6 months, I wasn’t using Tableau at work and I stopped for 3 months completely at one stage! So somehow with 3 months Tableau experience I was able to show Dyson enough that I landed the role within two weeks of applying!
I then set to producing more vizzes in Tableau public, seeking advice from one of our Tableau contractors, Steve Thomas. Just trying to use my three month notice period as effectively as I could to up-skill myself as quickly as I could. In that time I only produced a few more vizzes on Tableau Public, but one of them I was particularly proud of, which was the Kevin Richardson Foundation viz. This was produced as part of the #Vizforsocialgood project and I came up with the idea of creating a Lion head using polygons. I believe this viz started to raise my profile a little within the Tableau Community and to have one of the Zen Masters, Ken Flerlage, at the end of the year call it out as his ‘Viz of the year’ because he thought it deserved more recognition than it got, was stunning!
I now have been using Tableau daily for 6 months since joining Dyson. I’ve become more particular over what I do in the Tableau Public space. I don’t seek to rush vizzes out anymore, I scrap a lot of vizzes, because I hold myself to high standards now. Probably my favorite viz so far has been the History of the Six Nations I produced. This was because I had seen a lot of really interesting radial type vizzes that are produced outside of Tableau, you can find lots using Pinterest. But I hadn’t seen any / many using Tableau with multiple levels of detail. You will see radial charts, but they will have only one element to them. With this viz I had three or four elements going on in the same Radial. I wasn’t sure I could do it in Tableau, but after a few weeks of preserving I managed to get it to work. It won VOTD and was produced for #SportsVizSunday. I particularly like it because it again is on Rugby Union and works as a standalone poster, is visually attractive for a sport viz (which is hard to achieve) and technically challenged me!
Michael: You are a Senior Data Visualisation Developer at Dyson. Can you talk a little about how you help your business partners at work in their data visualization needs using Tableau?
Sam: Well, I still feel relatively new to Dyson – I’ve only been here for 6 months. Yet I must admit I feel very much like I have landed on my feet. My role at Dyson is purely a Visualisation role, I do very little if anything with building or amending data sets – this is perfect for me. I’m all about designing dashboards and engaging users through visualization! I have made my mark within the company already much quicker than I had expected, through a piece of work I ended making far bigger in scope than I was asked for. I was asked to review my own team’s suite of reports and find a way to make them more cohesive and connected visually. What I ended up producing was a comprehensive set of design standards, support document and review process around branding and design. Which sets out what our analytical output should look like. This document was entirely built within Tableau, it covers the whole range of Tableau elements, detailing design best practice, colour principle, technical Tableau help, how our reporting works and I was able to embed 12 dashboards of different chart types to provide inspiration to our developer. This was aimed at on-boarding new users, whilst also helping those that have been using Tableau for 3-4 years understand principles around design they may not have understood previously. This was build for my own team originally, but we felt it was so detailed, so comprehensive and of a great standard that I then opened it up to the rest of the business and their own analytical teams, whether they use Tableau or not! I have been running face-to-face sessions on how to use this document and how to help embed it within other teams. It has been hugely successful with a large quantity of teams adopting it for their own purposes. Which isn’t too bad having delivered that only four months into my career at Dyson (not to forget this is my first Tableau-centric role!).
I am continuing to develop this set of standards, which I’ve named the Tableau Design Framework. I’m constantly looking to keep pushing the boundaries on what we do to best support our end users.
To give a little context of my own team at Dyson. I work for the Global Quality team. We work with the largest data sets in the organisation, and our data is all centered around Reliability of our machines, Connected data of our products with apps, Safety data, user reviews / perception and even Corporate Social Responsibility (CSR). These data set are vast, and rich with information. We use Machine Learning to further enrich our data also. As part of my first 6 months. I contacted face-to-face surveys with our end users, to understand which reports they were using, why they were using the reports they did and what was their perception of the standard of our reporting, from both and insight and design perspective. As part of this we had a particular focus on overhauling our Reliability focused dashboards. We are now just at the point of delivering these new reports, vastly reducing down the number of reports our users were interacting with and focusing the insight through different channels. Effectively cleaning up the reporting suite and making a more obvious pathway for the users to follow to get their insights. All of this has been done with adhering to our Design Framework standards. We have also worked through the backlog of core reporting updating all to meet the Tableau Design Framework standards, so now our reporting suite is meeting that objective of being a more cohesive and visually connected set of reports. This is a success I’ve very proud of. We are now working on Brand and have a far more professional feel to our reports.
Within Dyson I
have tried to make myself available as a Tableau Champion, running training
sessions for new users, being available for ad-hoc help and advice across all
teams. I happily make myself available
for presenting Tableau at Lunch and Learn sessions as well.
I have been
working on getting the Tableau Design Framework published to Tableau Public,
but so far I have been stopped at the 11th hour. I hope in the future I am able to share it
with everyone in one form or another.
Michael: Can you tell us three of your favorite Tableau Desktop tips and tricks?
Sam: OK, let me think! I would never do well in one of those Tableau Tips Battles that they sometimes have on stage at the conferences. But here are a few tips I like to use:
Measure Values. For a long time with Tableau I found applying measure values on my worksheet hugely frustrating, as when I dragged Measure Values to the Marks Card, it would bring with it most of the measures I had in the data and then I would have to drag off the ones I didnt want and then add in the ones I did need. So my tip is this. Before dragging Measure Values to the Marks Card, drag Measure Names to the Filter Card and then select the measures you need with the filter. After that filter has been applied, then add the Measure Values to the Marks Card and hey-presto the measure you need are there instantly!
This is less of trick, but more about good practice. After completing a dashboard, you may find you have a high number of Calculated Fields in against your Dimensions and Measures. You may have even spent so long on that dashboard / workbook that you’re not sure which are used anymore. I personally believe it is good practice to go through and tidy up your workbook before signing it off. To do this, In the Data Pane on a worksheet, select the little down arrow next to the search symbol, in that list select “Hide all unused fields” this will take away any fields from the Dimension / Measure Lists that are not used. What I like to so is then select “Show Hidden Fields” from the same drop-down list. This brings those hidden field back into view, but they are grayed out. You can then go through each grayed out calculated field and confidently delete them from the workbook, without any fear of impacting your Dashboards. I feel this is good to do, so any other Developers in your team can then pick up your workbook in the future and they are presented with a clean set of calculations which they can work with and understand.
My last tip is to utilize containers and padding. Especially in Business Dashboards, you want control in how your Dashboards are presented and to know they will render consistently. For this reason I have instructed our teams to only build dashboards using containers and avoid floating as much as possible. Once you have your container structure in your Dashboard, then my tip its to create space between your charts, KPIs and text using Padding, we mostly use Outer Padding for this, unless you are trying to create a Divider line – in which case Inner Padding is good to bring through the background colour of the worksheet. Padding is preferable because it is not asking Tableau to render any additional objects on your dashboard, which is the other option for building space between charts using Blanks or Text Boxes.
Michael: You have been involved with #VizForSocialGood. I loved your The Plight of the Pride data visualization. Can you tell us a bit about The Kevin Richardson Foundation?
Sam: Kevin Richardson is a conservationist from South Africa that has a mission to highlight the status of Lions in Africa and the problems they are facing through captivity, habitat loss and bone trade. Kevin created the Kevin Richardson Foundation in 2018 that has a sanctuary reserve that is home to 30+ Lion that have been rescued from captivity.
‘The Plight of the Pride’ viz was my take on the data that was made available through the #VizForSocialGood project. I found the subject hugely engaging, I hadn’t appreciated the issues that Lions face today and was really happy to take part in this project. The center piece of this visualization really started to get me noticed out in the community. I created it by hand drawing the line head on paper, scanning that image into my laptop, I think used Paint (Yes, Paint!) to find the coordinates of every point on every shape that made up the Lion. These x-y coordinates were then input into Excel and then I was able to load that data into Tableau to produce an interactive Polygon Lion. I then from there tweaked a lot of the shape and colour of the Lion and at the time I tweeted a GIF that showed the process of be putting together the whole viz from start to finish (Link). That went down really well at the time. I am already thinking of doing more things like this using Polygons. It’s just a matter of finding the right subject.
Michael: If you could magically be alone in a room with Francois Ajenstat, what would you ask him to add into Tableau Desktop?
Sam: Haha, this is where I have to admit my naivety, I had no idea who this was until recently when I read one of your other interviews!
This is difficult, because with each release, Tableau spoils us with amazing new features. I know a number of the community have been vocal about supporting more fonts in Tableau Public, but I understand there is licencing issues around this, so I’m not going to list that one.
Here are my 3 requests:
A really quick win would be introducing a Spell Checker. I find all the time that I’m having to take my text our of Tableau and paste it into Word to check the spelling. That’s just bonkers! Even with my IronViz, I did this and still managed to miss typos.
I would really like a button that when you are creating a chart in a single worksheet, you can press that button and it shows you how that chart is rendering in your dashboard. I find a lot of the time when using circle mark types, that you can size the circles in the worksheet and then they appear a different size in the dashboard, so you have to flick between one and the other till you get it right. So a button that could pop up the viz from the dashboard would be ideal for me!
Lastly, this is something I encounter all the time at work, when creating a business dashboards, is after creating a hierarchy of different category levels or region & countries, you then want to filter by all these options. You end up either adding multiple individual filters, or composing you dashboard, by building in charts that hold the same information, so you can filter using actions. What I would like is a Hierarchy Filter type, so you can filter through the hierarchy level and options all within the one filter.
So for
example, all within one filter: Open up ‘America’ from a list of countries >
open up “Montana” from the list of states> then select a number of Montana
counties to filter the view.
Michael: What is next on your “To Do” list? What can the Tableau community expect to see from you in the near future?
Sam: I have been working on a few map based visualizations. Trying out a few different styles, annoyingly I’ve not got anything ready for publishing at the moment.
In June, I am massively excited to be going to my very first Tableau Conference in Berlin. I will be meeting up for the first time with a lot of people I have connected with in the community over the past year. It’s going to be great to finally meet in person those people and talk data viz with them! Not to mention getting fully immersed into the conference. One thing on my agenda is to attend any talks on Extensions. I’ve never used this feature of Tableau and I am keen to hear of use cases in other businesses.
Lastly, I’m going to see what the next IronViz feeder round topics are and leave it to then to decide if I will compete again. I’m not feeling any real pressure to compete, and will take it as it comes!
My path into data visualization is like many others: convoluted, messy, and more akin to sailor becoming shipwrecked in a new land than a Captain elegantly following the stars. I’ve worked in retail, food service, ministry, recycling, and analytics. I’ve dropped out of grad school twice, a folklore program and a bio-statistics program, to pivot my career and take advantage of new opportunities. I entered the BI and analytics space five years ago, moving from ETL into reporting and into data science. My diverse / bizarre background provided me with a unique perspective into communicating insights, and I became the lead of a data visualization consulting practice, overseeing the work and growth of about 30 consultants. Simultaneously, I served as the lead data storyteller in a data science practice. Currently, I’m the Creative Director, Analytics, at Front Health, developing analytics products for clients and providing data visualization design strategy consulting in healthcare.
Michael:
Hello Josh. First off, congratulations
for being the winner for the 2019 Tableau Iron Viz global qualifier with your
data visualization Pasture and Crop: The Ways We Farm Our Land.
If I may, I’d like to ask you questions
a bit differently that I usually do in my interviews. My reasoning for this is
that I just loved how you broke down your process in your blog post on your Jackalope Data + Design web site (link
provided above).
After going through several iterations,
you ended up with a three phase, 21 step
process to create your IronViz entry as you visualized in the screenshot
below.
You spent approximately one-third of your project time on research.
In reading your blog post on the process, you did some extensive research to
get to your summary argument (shown
below).
So, from all this research, I found the truth I wanted to tell: I wanted to show the world that agriculture is more complex than a redneck on a tractor, and that our sustainability efforts need to match this complexity. I get frustrated by media and pop culture marketing of agricultural trends (don’t get me started on “free-range” chickens, where the minimum requirements are often poorly executed and actually cause a number of health issues in chickens).
So, a couple of
questions here.
Most of us learned how to research and profile data as part of our jobs in the IT/BI & Analytics profession. You talk about examining the variables, studying the metadata, reviewing census data definitions, and then researching industry trends. How did you learn how to do all of this and then be able to determine what was necessary to reach your summary argument?
Joshua: Great question. My emphasis on research comes from both my creative and analytical backgrounds. In creative arts, especially writing, the best novels come from deep research to create a storyworld that feels authentic. For example, I’m re-reading American Gods by Neil Gaiman. I’m struck by how much research he had to do to understand the lore and mythologies of so many different cultures and to portray his characters in ways where each one feels so unique and descriptive of the various cultures they represent, even down to the speech patterns. As my professional roles began incorporating more UI/UX design, UX research became a skill that expanded this same “storyworld” mindset. Someone once told me that UX design is really just about writing a story. The users of my analytics are the characters, so I have to do a lot of research to understand the setting and the characters in order to create that story. I need to weave an interactive narrative that addresses their conflicts (pain points) meaningfully.
On the analytical side, I had the pleasure of working for, and being mentored by, the greatest analyst and data scientist I ever met: Dr. Chris Holloman. Chris always emphasized a deep understanding of the data generating process. Where does this data come from? How is it created? This was so important to Chris that it was a very large part of our analytics process, either before or in tandem with basic univariate, exploratory analysis. The most important lessons were the times when understanding the data generating process dramatically changed our analytical plan. For example, one time Chris and I worked for a quick-service restaurant, trying to build predictive models to help drive faster service. Before we got our hands on the data, Chris worked with the client to get us a lot of time “behind the scenes”, so we got to stand in the kitchens watching the magic happen as burgers were created. We noticed so many important details that completely changed how we looked at the data. For example, orders are marked as “fulfilled” when an associate pushes a hidden button. The button is a binary, so there’s no way to skip orders. If there was a long order in the queue, other orders might be delivered first, but they couldn’t mark them as complete until the first order was delivered. This explained so many patterns in the data where we saw one order take a really long time, and then three or four orders being completed in milliseconds. This presented an interesting challenge – our dependent variable, time to delivery, was completely flawed. If we hadn’t seen the kitchens in action, we’d have missed this – and delivered incorrect or inaccurate analyses.
So my emphasis on research is both about understanding my storyworld, but also about understanding the data. I’ve found, repeatedly, that a failure to do this is the most certain indication that an analysis will be incorrect or flawed. Without deep research, we’re either misrepresenting the story or we’re misrepresenting the data – both of which are ethical failures for the data visualization and analytics disciplines.
2. You sought feedback from local farmers (subject matter experts with deep experence) and laypersons (co-workers, non-data people, etc.).
Can you talk a bit how you presented your findings to each group? For example, with your local farmers, did you approach them with charts and summaries of your findings, and I am curious, what assumptions did they find most incorrect?
Joshua: I’ll admit I had a leg up since I grew up surrounded by farmland, which gave me some initial insights. However, I personally grew up on a lumber farm, which only gets harvested once every few years – so relying on farmers that worked with livestock or some of the faster-rotation crops was important. One of my best friends comes from a family of hog farmers, and he was a very strong source (we also meet for exercise most mornings, so we could have frequent touch-points to review my analyses). I also had farmers in my network from home, and then I also work with a couple farmers. When working with the farmers, I often didn’t happen to have my charts in front of me. A few times we had a whiteboard or paper present, so I would draw the general trends I saw. Our conversations were very casual and exploratory, e.g., “why would a farmer report land that was both cropland and pastureland?”, or “are there reasons why more chemicals are used for corn?”
I found that some of my assumptions about crop rotation were flawed. Growing up in a rural school, crop rotation was actually part of our curriculum. However, I assumed crop rotation was a year-over-year thing, but I found out that a lot of crop rotation happens within a year. Also, I assumed livestock farmers that grew their own crops were devoting it to their livestock (as hay), but another friend told me that a common practice is to harvest and sell the head as grains, and to keep the stalks as straw for bedding (while keeping some of the grains as protein supplements for their livestock). I also learned a lot about farming families which made me incredibly distrustful about the demographic data, e.g., farmers living away from their farms; often that’s because families will spread out away from the farm, but still live relatively close: For example, my one friend has an entire road named after his family. Only his parents live “on” the farm, but they all live within a mile of one another. Or, another example is the issue of women in farming: anecdotally, many of my farming friends felt like there are a ton of women in farming, but there’s a more nuanced issue where women aren’t considered the head of the household, so it looks like women aren’t as present in the industry (although this describes another women’s rights issue). I couldn’t find any ways to sort this out from the data. There were a ton of things I learned, even as someone familiar with the basics, but these were probably the most critical to my final story.
For laypeople, I tried to get a blend of data literacies, but just as important I wanted to figure out what’s interesting to non-farmers and non-data people. That’s tricky: often the things I found interesting were boring, because non-farmers lacked the context. Other times, I found something to be obvious, but non-farmers found it intriguing because they’d never seen it before. This often took the form of a bunch of exploratory charts that I would show laypeople, explain the chart, and ask for their reaction. I did several rounds of this until I felt like I landed on some interesting trends that could be interesting to a wider audience. I remember one that was most fascinating to me: the difference between fertilizer and manure use vs. the percent of cropland in a county. I locked in on those trends early on, but all the laypeople thought it was boring – until I provided enough context. The feedback from laypeople really hammered in the idea that my final work really needed to have a ton of context, or else audiences wouldn’t understand why my insights were so important.
3. One of the things you emphasize in your blog summary was that you did not just sit at your computer and hack this out. With the ease of quickly creating data visualizations in any BI&Analytics tool, it is easy to forget that it is really all about the data, and the truth underlying that data. I especially like the fact you took a break for five days to let it percolate in your head to develop new ideas and outcomes.
Can you expand a bit more on your thoughts on this?
Joshua: There’s a few things from my process I want to emphasize — things I don’t think get enough vocal value. First, you’ll note that I had Tableau open for less than half of my process. That’s because of the emphasis I put into research, design strategy, and feedback.
Part of it is that the research – e.g., talking to farmers or reading periodicals – couldn’t happen in Tableau. But I’ve also found that, with any creative art, a lot of the magic happens in the real world. I’ve solved some of my most challenging problems, or made some of my greatest art, while tilling soil or cutting firewood or reading a book or even sleeping. There’s something about getting into the real world that let’s my brain create metaphors, which translates into new abstract structures to understand what I’m working on.
As
for setting the project aside for five days, this comes more from my creative
background (specifically creative writing). I have a few published poems, and
most of the publications came are revisions that came from letting it set for
quite some time (even years). Sometimes it feels like driving off-road: even
though I’m exploring new territory, I’m also creating my own trenches and
eventually I can get stuck in my own tracks. If I set it aside, the ground
dries back up and I can get traction to drive onto new ground. I can get so
focused within my current mentality that my focus is too narrow, and setting it
aside helps my current ideas “dry” a little, and I can get out of them and
explore something new.
And, on top of that, there’s a certain irony in that the first IronViz feeder, with the agricultural theme, came out during one of the busiest times for farming. As someone that maintains a pretty healthy garden (about 25’ by 18’), I’ve got a lot of initial work to get it going, so I had to set it aside to make sure I got the soil ready for planting.
4. You show a lot of passion in your Design Strategy commentary. Can you discuss your design strategy in terms of advice for others to use as inspiration going forward in their careers?
Joshua: I had a really big turning moment in my career when I was talking to someone that runs a design consulting company. He said to me, “I think you’re kind of like me. I’m really good at design strategy. I’m o.k. at design implementation. My best work comes by finding and working with and leading a team of really good artists.”
I hadn’t thought about the difference between the two, but it’s a really important nuance. Most of my professional work has been exactly that: I’ve worked with a team of designers and developers. It was my job to listen to the client and figure out ways that data, presented through a well-designed UX, could help them solve their problems and accomplish their goals. I was responsible for identifying the data to analyze, the architecture of the experience (how many dashboards? how do you navigate from one to the next?), the content mapping (what information lives where, and who accesses it?), and the very rudimentary wire-frames (how is content organized?). However, I felt like my designs were really good, but not amazing. Meanwhile, the designers on my team could take my ideas and evolve them to the next level.
It
contributed to some severe impostor syndrome for quite some time, until I had
the conversation I mentioned. I realized that there is a difference between the two, and I’m really good at all the
things that go into a good design. I’m good at the research, and defining the
problem, and casting a vision on how we can solve that problem. However, I’m
better at leading others to innovate within
that vision.
My IronViz is a great example. Everyone I showed said the same thing: it looks “clean”. It was a compliment, but it also demonstrated that I’m a traditionalist. Compare that to Sam Parson’s IronViz entry, where everyone said “wow!”. Now, having read Sam’s (NOTE: Sam Parsons) thoughts on this blog, I know a good amount of strategic thinking went into his viz as well, and I’m not implying he’s not good at strategy – but it isn’t hard to see that his IronViz entry is more innovative within his strategy than mine was (and, for what it’s worth, I think it’d be a blast to pair our talents up on a collaborative viz – so Sam, here’s an invite!).
If
you’re wanting to up your design strategy game, research is key. At the core of
design strategy is being able to adequately define everything. From there, the
easiest starting point is to think about the user experience: what do you want
users to feel, learn, and do? Then, make
sure all your design choices reflect
that. If you want them to feel excited, use bold colors and high contrast! If
you want them to feel calm, use softer colors and a lot of white space.
Carefully architect your insights so they are accessible to your intended audience – and, don’t be
afraid to present them in a way that isn’t
storytelling (in fact, I would say most of our vizzes, including my IronViz
entry, are not stories, but rather
expositions or descriptions). There are other rhetorical techniques that can be
just as powerful as storytelling, so trying to force something to be a story
when there aren’t characters or events means you’re missing some really
important paradigms of communication.
…in fact, I would say most of our vizzes, including my IronViz entry, are not stories, but rather expositions or descriptions.
One
last note on design strategy: when someone provides feedback, don’t blindly
apply it. Compare it to your design strategy. I’m not a huge fan of directive
feedback that ignores strategy. “Don’t use red and green” may not be helpful
for a Christmas viz! Instead, think about what you’re trying to accomplish. If
you get feedback that your viz might not be accessible to the red-green color
blind, see if you can tweak the saturation or luminosity without abandoning the
red-green colors. This is just an example, but most of the feedback I see is simply a directive, but there’s
little to no explanation on where that directive is coming from. If someone
provides directive feedback, it’s helpful to ask why they are suggesting that, so you can’t find out why your
execution isn’t accomplishing your design strategy. If you’re providing your
feedback, consider pairing your directives with why you’re suggesting that (and
maybe abandon the directive!) – this allows the person to go back to their
design strategy and re-evaluate their execution.
…most of the feedback I see is simply a directive, but there’s little to no explanation on where that directive is coming from.
Michael: My wife has a big herb garden in our yard. It
spans a 6 foot by 3 foot above ground vegetable planter (keeps the dogs from
eating everything!), several long rectangle planters for herbs, ceramic pots of
flowers, etc.
I found this
photo of your herb garden on Twitter. Can you tell my readers a bit about your
garden?
Joshua: There’s really four parts to my garden. The first, the part you noticed, is my herb garden. We’ve got a good variety of things that grow, but with an emphasis on things that come back every year or at least for two years. We’ve got parsley, cilantro (hint, don’t grow those two next to each other, they are hard to distinguish when they intermingle!), oregano, purple and sweet basil, catnip (actually makes for a good tea, and fights of mosquitoes), chives and garlic, sage, eucalyptus, and four mints: spearmint, peppermint, chocolate and mojito. The mints are pretty invasive, so we have to cut them back – but they also make for a nice cover in other landscaping areas.
My main garden is a mix of vegetables
and melons. Half the garden is devoted to large vines or bushes: watermelons,
cantaloupe, honeydew and cucumber. These are pretty water-intensive, so I can
focus my sprinkler there for the bulk of my irrigation. The other half of the
garden is zucchini, peppers and pepperoncinis, green beans, and tomatoes.
The buckets you see is the next part,
for carrots and sweet potatoes. I don’t care to till super deep for root
vegetables, so we use buckets (make sure to drill holes to draining!). It’s a
bit tricky to find enough top soil without scalping my yard, but those buckets
will give us a lot of heavier veggies.
Then we have our berry garden, which is a
slower process. They are perennials, so we don’t lose our progress every year –
but it takes more time to get them going. We’re at year two for our blueberry
bushes, blackberries and raspberries. I imagine we’ll get a good handful of
each this year, but we’ll probably start getting a good harvest next year or
the year after. We also have our strawberries there.
And, not really our garden, but we’ve
got five mulberry trees and an apple tree and a walnut tree. The apple and
walnut trees currently aren’t producing much because they need some pruning,
but with a little bit of work we should be getting buckets of both (although
there’s a chance the walnut tree might be keeping the apple tree from
producing, so I need an expert consult on that).
We can’t truly claim organic, because we
didn’t buy all organic seeds and starts. However, we don’t spray anything for
insects or weeds or fertilizer (our fertilizer is organic manure). Instead, we
try to maintain a balanced ecosystem. We try not to kill spiders and centipedes
because they eat a lot of the damaging insects. We plant things that will
invite natural pollinators like bees and butterflies. We put cardboard over our
walkways to prevent sunlight from getting to most of the weeds, and we till it
into the soil the next year for the earthworms. I let much of my garden
decompose in the fall so that some of the nutrients are replenished. All of
these are things we can do on a small scale to avoid chemicals – but, before we
judge farmers, it’s important to realize that a lot of this is really difficult
to do at scale, and I’m not in danger of losing any income if it doesn’t work.
This gardening keeps me really busy over
the summer, but it’s incredibly enjoyable and keeps me really active. I spent
most of my youth working outside, and being stuck inside with abstract measures
of productivity of my biggest struggles working in analytics. This weekend and
evening work helps address that, and it puts food on our table
Michael:
The Jackalope. Myth or misunderstood? Why does the jackalope appeal to you.
Joshua:
It’s definitely a myth, although there is a virus rabbits get that makes them
grow things that look like horns or antlers.
There are a few fun details about the jackalope that I’m drawn to. First off, it’s a blend of things that shouldn’t go together, which really captures my diverse skillset that comes from my convoluted background. Often in IT you’ll hear that someone that has all the skills needed for data science or UX design described as a unicorn. However, I don’t think of myself that way for two reasons: first, I’m not elegant enough to be a unicorn; and second, I’m not advertising myself as the complete package. It’s more that I have an unexpected combination of skills that provides a unique value, not that I have all the skills.
Second, the jackalope appeals to some of my other interests. It’s a folktale, and my first attempt at graduate school was in a folklore program. I love folktales and folk traditions, and the ways these things communicate meaning. Also, the jackalope is very rural Midwestern and western. My rural, Midwestern upbringing is a big part of my identity, so the jackalope felt fitting. Even though the original tale isn’t from my home state, it is commonly told and recognized here so it feels like a symbol of home.
Michael:
So, with the IronViz Championship waiting for you at TC19, how do you get
yourself ready for this?
Joshua: Good question! I’ve been really focused on getting my garden back up to speed, so I haven’t been in Tableau much outside of work. I’ll be diving back in soon, but I’ll be reaching out to a few people for advice. The cool thing about the #datafam is that I’m not going to be on stage alone. There are so many important people that have helped me get here, and I’m going to continue working with them to refine my skills.
Also, I’m really excited to see who I’m up on stage with, and I don’t mean that from just a competitive perspective. I hope the other two contestants become good #datafam friends. Sure, only one of us will win, but I don’t know that it’s fair to say the other two “lose”. This challenge is such an honor, and regardless of the outcome, I know that there is going to be tremendous growth between now and November. I’m hoping that the three of us can share that with one another, while maintaining a friendly competition. I love watching boxing, and one of my favorite parts are when the athletes congratulate each other after the match (let’s ignore the trash talk for show before the fights!). I’m kind of excited for that moment, regardless of which side of the equation I’m on.
NOTE: Below is a link to an article and video about Joshua’s role in providing customer solutions using Tableau. It is titled Front Health improves clinical quality, patient health, and total cost of care with Tableau.
This week, I submitted my first ever entry into a Tableau-related dataviz competition. The competition is #IronQuest and the topic had to relate to sea creatures. I contacted Sarah Bartlett, the organizer of the #IronQuest, to see if I could use a mythical sea creature. She confirmed I could, so I decided to have my entry focused on on of my favorite mythical sea creatures, The Creature From The Black Lagoon.
I really liked Joshua Smith’sA Fan Made Data-Driven Tribute to Captain Marvel (see screenshot snippet below). I had recently interviewed Josh for my dataviz blog and talked to him a bit about superheroes. Josh is more of a Marvel Comics person (e.g., Avengers, Captain America, Spiderman, etc.) and I am more of a DC Comics person (e.g., Superman, Batman, Wonder Woman, etc.). But, both of us agreed we could cohabitate in the world with this difference between us, so I decided to use his Captain Marvel dataviz as the foundation for my Creature dataviz.
Josh Smith’s Captain Marvel dataviz
Josh was very generous in reviewing multiple iterations of my dataviz as I was developing it. I will point out recommendations Josh made as I progress through this blog post. With his knowledge of creating a dataviz to have a comic book-style look-and-feel, his recommendations and insights were invaluable to me.
As a young boy (and probably as a grown man now too), I have always loved monster movies. I think the original Frankenstein movie was brilliant. I loved the early 1960s-1970s Planet of the Apes movies, and even have my home office decorated in Planet of the Apes merchandise. I use to go to the San Diego Comic-Con every year with my boys when they were younger, and have met most of the original cast from these movies. Plus, some years at Comic-Con, they even had props from the original movies on display.
Planet of the Apes Movie (1967)
But I digress.
I have always had an affection for the Creature From The Black Lagoon movie. When I was a kid, we use to go to the movie theaters on Saturdays and watch movies all day long. There were monster movies, the old Batman serials, Westerns, etc. Admission back then was 50 cents for the entire day.
The Creature was always an interesting concept. Here was this half-man, half-fish dating back to the Devonian Period. As was typical in most monster movies, there were a group of “good” scientists who wanted to understand and communicate with the Creature. On the other side, there was the “bad” scientists who wanted to kill him, stuff him, and put him on display (and make a lot of money).
It has been a while since I had actually watched the movie. So, I found a copy on YouTube and watched it again. As I watched the movie, I wrote down key words, things of interest and events that occurred during the movie. The main thing that stood out to me, and was the basis for the plot, was the discovery of the fossilized skeletal hand with web fingers. This event set into motion the expedition back to the Amazon River to see if they could find the rest of the Creature’s skeleton.
So, as I started to sketch out the dataviz on paper, I had an idea where a photo of the skeletal hand was at the top of my dataviz with a brief summary of the plot of the movie. Fortunately, I was able to find a photo of all of the scientists, at the institute, standing around the skeletal hand and discussing it in a scene from the movie.
Scientists study the fossilized skeletal hand
I also keyed in on words and sentences from the movie such as Devonian Period and Amazon River.
The Black Lagoon
I did some additional research, and found a blog of a river boat company that did tours of the Amazon River. One of the things noted in the blog was them following the Napo River through the tributary and entering the Black Lagoon. I thought having a spatial map of that area of the Amazon River would help set a feel for location and context of where the action was taking place. I did some Google searches and found a Shapefile that contained the rivers located in that area. To give it additional context, I added an annotation where the river boat company stated they entered the Black Lagoon. Creating the map and adding an annotation of where the Black Lagoon was was a fairly straightforward thing to add to the dataviz.
In following Josh’s Captain Marvel dataviz comic-style, for my narratives, I used floating text boxes with a title of the topic, followed by a brief description. Josh used the font Tableau Light, all uppercase, and italicized to give it more of a comic book look-and-feel. He recommended I do the same, and I followed this method. In later reviews, Josh mentioned that I should put a border around the text using the second or third largest line width. I added this using the third largest line width size, and decided on using black as the border color, which I felt emphasized the text more. Josh also recommend I add 5px of inner padding inside each text box so the the text was not flushed against the border of the text box.
Now, before I continue, I need to provide a disclaimer here. I use Tableau every day at work. However, most of the data vizzes I create are move interactive grid reports. My employer is still finding their legs in regards to using Tableau and the business communities comfort level is with this style of reporting. In the future, I envision more visual data visualizations being incorporated into the mix, but for now, it is what it is.
With that said, I do not do a lot of highly visual data visualizations at work. So, my entering #IronQuest was a way for me to do some of the things I have been wanting to do, as well as using some of the newer features in Tableau such as Set Actions (more on this in a bit).
Based on past readings I did, I knew that the Amazon River was one of the longest rivers in the world. I did some additional research and was able to find a dataset for the longest rivers in the world. Since I did not want to use a lot of space for this chart, I limited it to the top five. I used a simple horizontal bar chart (my usual go-to chart) for this.
I want to point out a best practice I follow here for my tooltips. I try to have my tooltips be sentences versus the default label/value that Tableau provides. Below is a screenshot of the tooltip I used in the bar chart above.
Tooltips as sentences
Next, I wanted to include something about the Devonian Period as it is mentioned several times in the movie. I again did some Google searches and found quite a bit of information on this topic.
Each of the geologic periods were noted in values of Millions of Years Ago (or MYA). I first thought about building a simple timeline, but wanted to try something different. I have used dumbbell charts in the past and thought this would be a good way to express a geologic period’s beginning and end. I also included in the tooltip some of the characteristics that were associated with that geological period.
So that the Devonian Period stood out, I used a different color to emphasize that period. The yellow shade I used I color picked from the Creature From The Black Lagoon movie poster to (1) use colors consistent with the poster, and (2) to work with a small set of colors overall.
Dumbbell Chart of Geologic Periods
The next piece of the narrative I wanted to include was about the fact that there were two different people playing the Gill-Man (NOTE: Because of copyright and other legal issues with Universal Pictures, you will see the Creature often referred to as the “Gill-Man” in non-Universal Pictures references). In my old Comic-Con convention days with my boys, we had the opportunity to meet Ben Chapman and Ricou Browning on several occasions. They are both very generous with their time with their fans, and both overall nice guys. I wanted to pay a tribute to both of them, as well as introduce this little known facts to the every day viewer of this dataviz.
Although, there is no Tableau magic in this portion of the dataviz, I though it helped with the story, and helped keep the reader interested in continuing to view the rest of the story.
Ben Chapman (left), Ricou Browning (right)
SET ACTIONS AND SWAPPING IMAGES
Previously, I had viewed Lindsey Poulter’s Tableau Public excellent workbook on Set Actions (I had previously interviewed Lindsey as well). I really liked her example using set actions to swap (or rotate) images. I thought I could add an element to my story where I showed Creature From The Black Lagoon movie posters from around the world. Lindsey had previously published step-by-step instructions of how she did this on her blog post, Rotate Images Using Set Actions, and between her Tableau Public workbook and the blog post, I was able to integrate this feature into my dataviz.
Rotating images using Set Actions
JITTER PLOT
There are A LOT of cultural references to Creature From The Black Lagoon. In fact, I included over 50 of them in my dataviz. I wanted to include these cultural references as a chart in my dataviz. I decided to have the chart organized by year and then media type within each year. The problem here was that there could be multiple cultural references within a year and a media type. I discussed this with Josh and he recommended I try to use a Jitter Plot.
I found a great tutorial by Michael McFadden on how to create a jitter plot on The Data School’s web site. As Mr. McFadden explains,
The main reason to use a jitter plot rather than a strip plot is when you have too many marks overlapping and either you want to be able to select any individual mark (which is difficult or even impossible if the marks overlap entirely).
Michael McFadden
I created a small example to ensure this chart would work for me. I really liked it and now had to proceed to the difficult task of finding, harvesting, formatting, and storing the cultural references data.
PREPPING THE CULTURAL REFERENCE DATA
Fortunately, there was a Wikipedia page of the cultural impact of the Creature From The Black Lagoon. I reviewed all of the information on this page, and came up with a format for it. However, I felt some of the references were either inaccurate or incomplete. Fortunately, Google was a lifesaver here. I was able to take the verbiage I saw and type it in as a search string in Google. For example, for The Munster’s episode where Uncle Gilbert visited, I wanted to find the name of the episode and the year it first aired on television. I typed “Munsters episode Uncle Gilbert,” and lo-and-behold, several television web sites that track episodes for shows pointed me to the exact episode, it’s name, and the date it first aired.
The Munsters are visited by Uncle Gilbert
BRIEF INTERMISSION:
So, indulge me for a second. I wanted to share a bit of dialogue from this episode with you. It was one of my favorite episodes.
Herman Munster: We were a little curious, where did you get all that gold?
Eddie Munster: Yeah, Uncle Gilbert, where did you get all those neat Spanish Doubloons and rare gold pieces?
Uncle Gilbert: Oh, those! Why, Eddie my boy, that’s, eh, loose change I picked up in ships and treasure chests lying around in my neighborhood.
Eddie Munster: No foolin’?
Uncle Gilbert: Sure, that’s one reason I wouldn’t live any place else in the world. Oh, there’s a lot of advantages, my boy, to being the Creature from the Black Lagoon.
END OF INTERMISSION
Other references that were in my head and not on Wikipedia were a bit more challenging. I remembered a country song by Patty Loveless where she talks about The Creature From The Black Lagoon. I though the song was titled “That’s All I Think About These Days.” It took me several variations of Google searches to find out the actual name of the song was “I Try To Think About Elvis.”
So, after using what I found on Wikipedia, my own personal remembrances, and just doing lots of Googling, I came up with over 50 cultural references. However, this is just a small sample of references. There are a lot more out there.
Cultural Impact Jitter Plot
Cultural Impact Tooltip
BACKGROUND COLOR
The background image went through several iterations (more than the three examples I show below). Josh felt that the original background had a lot of contrast in it between the green and black. He felt this was not a bad thing, but it was a bit distracting. He recommended me toning the background down by laying a slightly transparent “Blank” object over the background. He suggested I make the Blank object green, and then tweak the opacity so that the black still comes through – but with lower contrast, so it isn’t distracting.
As you can see in the image color evolution screenshot below, Image #1 was the image unaltered that I started with. I then reduced the image’s opacity directly using Snagit to create Image #2. In the final version (Image #3), following Josh’s recommendations, I created a green Blank object at 82% opacity and laid it on top of Image #2.
Once I did this, the colors in the various charts I had placed on top of the background image seemed to pop more, and this really improved the dataviz overall.
ATTRIBUTION, REFERENCES, SOURCES
Long ago, I learned the hard way of the repercussions of not attributing your sources. If you take anything from this blog post, I hope this is the main one you remember.
ALWAYS CITE YOUR SOURCES!
Since much of my dataviz is based on the format of Josh’s Captain Marvel dataviz, I wanted to include that in the attribution detail in Tableau Public. However, this did not work for me. I would paste in Josh’s URL for attribution, it seems to recognize that it was a dataviz from Joshua Smith, but would not let me save the page. I tried this several different ways but with no success. As of the posting of this blog post, I still have not been able to add attribution to Josh on Tableau Public.
However, I did add Josh to my attribution, references, and sources section at the bottom of my dataviz. I also added Lindsey Poulter as I used her Image Swap worksheet to create my image swapping. If you end up using a lot of different data sources and image sources like I did, I recommend you paste the information and URL in a Word document and maintain a list as you are developing your dataviz. You can then format it in the Word document, and then cut-and-paste it into a Text Object in Tableau.
Attribution, references and sources
SUMMARY
I am glad I decided to enter #IronQuest. It helped remind me of the time allocation needed for gathering data, designing, editing content copy, and building a Tableau dataviz. As I think back to all of the great datavizzes I really admire on Tableau Public, these #datafam members really put a lot of time and effort into what they created. Kudos to all of them.
I also realize I need to participate more in activities like #MakeoverMonday and #WorkoutWednesday. This is truly the best way to hone the craft that is Tableau; by continually creating datavizzes utilizing different chart types and techniques.
I hope you found my discussion on how I created my Creature From The Black Lagoon dataviz helpful. You can view it on Tableau Public by clicking here.
The latter is publicly traded and this deal will involve shares of Tableau Class A and Class B common stock getting exchanged for 1.103 shares of Salesforce common stock, the company said, and so the $15.7 billion figure is the enterprise value of the transaction, based on the average price of Salesforce’s shares as of June 7, 2019.
This is a huge jump on Tableau’s last market cap: it was valued at $10.79 billion at close of trading Friday, according to figures on Google Finance. (Also: trading has halted on its stock in light of this news.)
The two boards have already approved the deal, Salesforce notes. The two companies’ management teams will be hosting a conference call at 8am Eastern and I’ll listen in to that as well to get more details.
This is a huge deal for Salesforce as it continues to diversify beyond CRM software and into deeper layers of analytics.
The company reportedly worked hard to — but ultimately missed out on — buying LinkedIn (which Microsoft picked up instead), and while there isn’t a whole lot in common between LinkedIn and Tableau, this deal will also help Salesforce extend its engagement (and data intelligence) for the customers that Salesforce already has, something that LinkedIn would have also helped it to do.
This also looks like a move designed to help bulk up against Google’s move to buy Looker, announced last week, although I’d argue that analytics is a big enough area that all major tech companies that are courting enterprises are getting their ducks in a row in terms of squaring up to stronger strategies (and products) in this area. It’s unclear whether (and if) the two deals were made in response to each other, although it seems that Salesforce has been eyeing up Tableau for years.
“We are bringing together the world’s #1 CRM with the #1 analytics platform. Tableau helps people see and understand data, and Salesforce helps people engage and understand customers. It’s truly the best of both worlds for our customers–bringing together two critical platforms that every customer needs to understand their world,” said Marc Benioff, Chairman and co-CEO, Salesforce, in a statement. “I’m thrilled to welcome Adam and his team to Salesforce.”
Tableau has about 86,000 business customers including Charles Schwab, Verizon (which owns TC), Schneider Electric, Southwest and Netflix. Salesforce said Tableau will operate independently and under its own brand post-acquisition. It will also remain headquartered in Seattle, WA, headed by CEO Adam Selipsky along with others on the current leadership team.
That’s not to say, though, that the two will not be working together.
On the contrary, Salesforce is already talking up the possibilities of expanding what the company is already doing with its Einstein platform (launched back in 2016, Einstein is the home of all of Salesforce’s AI-based initiatives); and with “Customer 360”, which is the company’s product and take on omnichannel sales and marketing. The latter is an obvious and complementary product home, given that one huge aspect of Tableau’s service is to provide “big picture” insights.
“Joining forces with Salesforce will enhance our ability to help people everywhere see and understand data,” said Selipsky. “As part of the world’s #1 CRM company, Tableau’s intuitive and powerful analytics will enable millions more people to discover actionable insights across their entire organizations. I’m delighted that our companies share very similar cultures and a relentless focus on customer success. I look forward to working together in support of our customers and communities.”
“Salesforce’s incredible success has always been based on anticipating the needs of our customers and providing them the solutions they need to grow their businesses,” said Keith Block, co-CEO, Salesforce. “Data is the foundation of every digital transformation, and the addition of Tableau will accelerate our ability to deliver customer success by enabling a truly unified and powerful view across all of a customer’s data.”
Tableau 2019.3 Beta was announced at the Tableau Conference in Berlin this past week.
Here are a few of the new features coming soon.
Explain Data
Explain Data gives you explanations for unexpected values in your data with a single click. Available as you’re creating a viz or dashboard, Explain Data uses powerful Bayesian methods to surface statistically significant explanations. Behind the scenes, hundreds of potential explanations are checked and the most likely ones are surfaced. Every explanation is a viz, and can be explored with the full power of Tableau. This not only saves you time, as it brings you to the why quickly, but you can discover insights you didn’t know existed, and easily access and explore explanations.
Explain Data
Tableau Catalog
With Tableau Catalog you get a complete view of all of the data being used by Tableau, and how it is connected to your analytics – including lineage, impact analysis and usage metrics. Increase trust and governance in your environment by ensuring that end users know and understand data through the use of data quality indicators and defining rich metadata. Additionally, allow users to discover more relevant data and content by surfacing more relevant search results, putting the data in context with more data details when viewing a dashboard, and surfacing the right data when connecting to and authoring a viz.
Tableau Catalog
Project McKinley
Project McKinley makes it simpler to run large, mission critical Tableau Server deployments, allowing you to react to the changing needs of your business, and to save time by streamlining the management process. This new offering provides AWS KMS integration, new performance monitoring and content management apps, and additional scalability capabilities for Tableau Server.
Project McKinley
Extract Encryption at Rest for Tableau Server
For additional security you can now encrypt your extracts at rest. You can also think of this as object-level encryption. It’s easy to use—simply toggle it on per extract or enable at the site level. Tableau Online is already fully encrypted at the service level.
Extract Encryption at Rest for Tableau Server
Ask Data Improvements
Embed Ask Data into your company portal or Wiki, and you can enable even more people in your organization to be asking questions of their data.
Ask Data Improvements
Web Editing for Tableau Public
Edit and save any of your Tableau Public vizzes directly in your browser. Any changes will be automatically updated in all embedded locations.
Web Editing for Tableau Public
Favorite from the Tableau Public Gallery
You now have the ability to save vizzes from the Tableau Public gallery to your personal collection of favorites, making them easily accessible when searching for inspiration.
Favorite from the Tableau Public Gallery
Spatial Files for Web Authoring
Spatial file support has arrived to web authoring. Connect to KML, GeoJSON, and TopoJSON, to better understand and share your location analysis on the web. End to end geospatial analysis, all without leaving the browser.
Spatial Files for Web Authoring
New Search Results Page
Find what you’re looking for faster. Now your search results will be laid out on a newly redesigned search results page. See all your results by views, workbooks, data sources, flows, and other content types.
New Search Results Page
Improved Content Sharing
Share more easily with a simplified share experience. Share projects, workbooks, data sources, views and flows through Tableau Online and Tableau Server.
Improved Content Sharing
Publish Embedded Data Sources
Quickly and easily publish embedded data sources from workbooks to share with your team.
Publish Embedded Data Sources
Set Context Filters On The Web
Improvements to web authoring continue with the ability to create context filters and dependent filters in the browser to help drive the performance of your workbook.
Set Context Filters On The Web
Parameter Actions Improvements
Parameter actions just got more powerful with three new aggregation functions: first quartile, third quartile, and concatenation. You also now have the option to create new parameters directly from the parameter action dialog.
Parameter Actions Improvements
ISO-8601 Calendar Default
You can now set the ISO-8601 calendar so your date parts default to the iso-equivalent of year, quarter, week, and weekday for better calendar-based analysis.
ISO-8601 Calendar Default
Spatial Calculations: MakePoint Improvements
You can now convert projected coordinates for locations, which might be in feet or meters, into latitudes and longitudes that Tableau can visualize and use in spatial joins. For instance, the Seattle Police Department logs location data using a local projection in US Feet, and can now use MakePoint to convert it directly into usable lat/long coordinates.
Spatial Calculations: MakePoint Improvements
Spatial Calculations: Distance
You can now easily measure the distance between two points, perfect for measuring the length of flight or shipping routes or driving proximity analysis around a store or hub.
Spatial Calculations: Distance
PDF Attachment to Subscriptions
Consolidate your workflows with the option to receive a PDF attachment with your subscription to a dashboard. You can select to attach an image, PDF, or PDF and image, which will land in your inbox as part of your regular subscription email.
PDF Attachment to Subscriptions
Export to PowerPoint Improvements
Select relevant, specific dashboards to integrate into your presentations. You now have the option to select which sheets, dashboards, or stories to export to PowerPoint.
Export to PowerPoint Improvements
Connect to Published Data Sources With Tableau Prep
Connect to published data sources with Prep Builder and Prep Conductor, so you can build flows with all the data in your Tableau environment.
Connect to Published Data Sources With Tableau Prep
R and Python Integration for Prep Builder
Create a step to run an R or Python script in Tableau Prep Builder, taking advantage of your data science workflows.
R and Python Integration for Prep Builder
Optimized Joins
Optimize your joins. You can now control if your join is executed in Hyper, or the source database. Control this option from Tableau Desktop or at the site level in Tableau Server or Tableau Online.
Optimized Joins
DataBricks Connector
For customers using Spark, you can now take full advantage of the innovation of DataBricks as a native connector.
DataBricks Connector
New Product Language: Italian
Italian is now available as a language option, making Tableau feel more familiar for Italian speakers.
Update: I have had several requests recently for the Tableau Workbook I used in this blog post. I have just posted the workbook on Tableau Public. You can see it by clicking here.
Since it is on Tableau Public, it will currently be v2019.2. If you need an earlier version, please e-mail me at tableau@cox.net.
Thanks,
Michael
ORIGINAL POST:
Readers:
This is a requirement we have had for a while from our internal business partners. Through some experimentation and Googling various posts and articles in the various Tableau forums and web sites, I was able to achieve adding page breaks and page numbers into a Tableau worksheet (or view) which I was able to use when I created a PDF file. In my discussion below, I will show you how I did this.
If you want a copy of the workbook I use as an example, please e-mail me at Tableau@cox.net and I will send you a copy of it.
I hope you find this example helpful.
Thanks,
Michael
Adding Page Breaks and Page Numbers in a PDF file
First, using the Sample – Superstore data source, create the following worksheet.
Notice I dropped Statein the Page Shelf and I set Sales Amountto Compute Using State (see screenshot below). I also filter on the Sub-CategoryBookcases.
Now, before I go on, left me first discuss what the Page Shelf does.
Page Shelf – An Introduction [1]
The Pages shelf lets you break a view into a series of pages so you can better analyze how a specific field affects the rest of the data in a view. When you place a dimension on the Pages shelf you are adding a new row for each member in the dimension. When you place a measure on the Pages shelf, Tableau automatically converts the measure into a discrete measure.
The Pages shelf creates a set of pages, with a different view on each page. Each view is based on a member of the field you placed on the Pages shelf. You can easily flip through the views and compare them on a common axis, using the controls that get added to the view when you move a field to the Pages shelf. For example, the view below shows the Profit vs. Sales by Region for each day throughout the month. The image below shows days 1, 2, 3, and 4. You would have to scroll down to see other days in the month.
To make this view more user-friendly, move DAY(Order Date) to the Pages shelf and use the associated control to flip through the pages (one for each day). You can quickly discover hidden insights. In this example, it is interesting that the 19th is an especially big day in terms of sales and profit in the Western region.
When you add a field to the Pages shelf, a page control is automatically added to the right of your view.
Use this control to navigate through the pages. There are three ways to navigate through the pages in a view:
Jump to a specific page
Manually advance through the pages
Automatically advance through pages
Jump to a specific page
Select the member or value you want to view from the drop-down list to display a specific page.
Manually advance through the pages
You can manually advance through the sequence of pages by doing any of the following:
Use the forward and back buttons on either side of the drop-down list to navigate through the pages one at a time.
Use the Page Slider to quickly scroll forward and backward in the sequence of pages.
Use any of the following keyboard shortcuts to scroll forward and backward in the sequence of pages.
F4
Starts and stops forward playback
SHIFT + F4
Starts and stops backward playback
CTRL + .
Skip forward one page
CTRL + ,
Skip backward one page
On a Mac, these are the equivalent keyboard shortcuts.
F4
Starts and stops forward playback
Shift-F4
Starts and stops backward playback
Command-period
Skip forward one page
Command-comma
Skip backward one page
Automatically advance through pages (Tableau Desktop only)
Use the playback controls to watch a slide show of the pages in the view. You can play forward or backward, and stop the playback at any time. You can control the speed of playback with the speed controls in the bottom right corner of the control. The smallest bar indicates the slowest playback speed.
Show the Page history
Show page history using the Show History check box. With page history, marks from previous pages are shown on the current page.
In Tableau Desktop only: Open the drop-down control for history to specify what marks to show and when to show them.
The history drop-down control has the following options:
Marks to show history for – select whether you want to show history for just selected marks, highlighted marks, marks that you’ve manually selected to show history for, or all marks. To manually show history for marks, right-click (control-click on Mac) the mark in the view and select an option on the Page History menu.
Length – select the number of pages to show in the history.
Show – specify whether to show the historical marks, a line tracing through the previous values (trails), or both.
Marks – format the historical marks including the color and how much to fade them if the color is set to automatic, the marks will either use the default mark color or the color encoding on the Color shelf.
Trails – format the lines that are drawn through the historical marks. This option is only available if Trails is selected in the Show options.
Page trails may not display if there are multiple marks per color on a page. Make sure that the level of detail for the view is less than or equal to the level of detail on the Pages shelf and on the Color target. Also, trails are only supported for discrete mark types such as squares, circles, or shapes. They are not supported when the mark type is Automatic.
Pages on dashboards (Tableau Desktop only)
When a dashboard contains multiple views that use the same field on the Pages shelf, you can control all of the views with a single page control by selecting the Synchronized option. This option is only available on the page control shown on a dashboard.
O.K., back to my example: Adding Page Name and Page Numbers
Next, I want to add the State to the top of each page in the title as well as the page numbers (see screenshot below).
If you double-click on the title, you can add the State name for that page as well as the page numbers.
Page Name is the current page’s State name.
Page Number is the current page’s page number.
Page Count is the count of the total number of pages.
Here is how I formatted the title of the worksheet I showed in the example above.
Page Setup
Now, you need to change some settings in the Page Setup. You get to the Page Setup by using the File->Page Setup… menu options.
You want to make sure Break pages on pane boundaries is checked.
You also, want to make sure the radio button for Show all pages is selected. Notice, in the screenshot below, the panel shows you how many actual pages there are going to be in your PDF file.
Print to PDF
Now, you need to set some of the settings to print the PDF file. You get to the Print to PDF by using the File->Print to PDF… menu options.
Make sure you have the radio button for Active sheet selected.
Voila!
Here are screenshots for two of the pages of the generated PDF file, Arizonaand Nevada. Notice the Page Name in the title and the correct Page Number for each page. There are not pages for all 50 states since we filtered on the Sub-Category Bookcases.
Besides being a proud Cajun and a lover of puzzles, I can typically be found exploring the country and evangelizing Tableau. Data has enabled me to piece together solutions through visualizations. My passion is enabling talented individuals to pursue advancement of skills and encourage growth within their organizations. I dream of fun, everyday occurrences that should be beautiful visualizations.
Michael:
Hello Katie. I was admiring your
data visualization that you created for guests at TC18 in New Orleans. Can you tell my readers about your process to harvest
the data, design, and then create this dataviz in Tableau?
Katie: Hey Michael – thanks for the invitation to be here with you! I had so much fun building the NOLA viz. As soon as I heard the location announcement, my #1 goal was to ensure our #datafam loved Louisiana as much as I do. I knew that everyone would use sites like Google, Yelp, etc. for recommendations, so I wanted to give the audience a unique experience. I contacted a few friends who’ve lived in or heavily visited NOLA to create the list. I took ONLY local recommendations, thinking about the different travel vibes of our diverse community. I knew not everyone would be interested in drinking until 3:00 am, so I wanted to be sure to include things like coffee shops and live music. Having attended four conferences, I know that most people don’t lug around heavy laptops, so ensuring the viz was mobile friendly was another high priority.
My design process always starts with big ideas – getting them to paper is a totally different challenge! I sketched a few ideas and brainstormed with colleagues at InterWorks. The quality of the viz was certainly enhanced by assistance from creative minds along the way. A friend suggested finding a color scheme that represented my vision of New Orleans. I tested a few, but decided to stick with a palette close to the local minor league baseball team, the Baby Cakes.
I iterated SO. MANY. TIMES. My vision went from a long, scrolling dashboard to the short, parameterized version you see today. I built different borders/images and published what felt like 100 copies to Public. As with many of my viz projects, the deadline approached and I decided to go with my friend Vince’s quote: “Done is better than perfect”. I’m really pleased with the final viz, and I think many people continue to receive value from it. Alteryx Inspire 2020 is headed to NOLA, so I hope even more people find it entertaining and helpful.
Michael: You are an HR Data Analytics Specialist with CBRE. Can you talk a bit about how you help clients with their data analytics needs using Tableau?
Katie: I’ve been in my position with CBRE for only a few weeks now, but am already loving the opportunity to make an impact with employees of the company. Our Workforce Analytics team focuses on metrics like promotions, diversity, compensation, benefits: all components that are critical to employee engagement and happiness. With 100,000 employees globally, we’ve got quite a population to analyze! I find this position very relatable with others in the Tableau Community, as almost every organization has a Human Resources team. I’m really looking forward to joining user groups, participating in training, and meeting more people in this space.
Michael: Previously, you were a Training Lead teaching Tableau. I have taught several internal Tableau Desktop classes from the beginners level to the Jedi level, and only now starting to feel more comfortable teaching Tableau concepts to others. Can you provide some recommendations to those who will be training others within their organizations on how to teach Tableau to others?
Katie: Absolutely! I value the experience I’ve received as an accredited Tableau trainer because it motivated me to invent creative explanations, solidifying my knowledge of the content. I’ve carried that part of my role over to CBRE, and will be responsible for training our Workforce Analytics team in Desktop. Here are a few suggestions:
1. KNOW THEIR MOTIVATION – Our team set a goal to be certified by the end of the year, so I’ll include a breadth of topics to ensure we’re covering all components of the tool. If your team is already familiar with Tableau, your time may be better spent reviewing challenging calculations, company style standards, or tackling common pitfalls you’ve experienced.
2. INCORPORATE THEIR STRENGTHS – If at all possible, keep the group size small and ask the individuals HOW they prefer to consume the information. Many of us have been through years of academic education and have identified whether we want to see/hear/do. Tailoring the teaching style to multiple learning styles typically yields stronger results. I try to remember that “if someone doesn’t understand what I’m saying, it’s usually my fault first”. Meaning…a learner isn’t unintelligent if they can’t grasp what I’m teaching – they probably just need to hear/see/do it again or in a different way.
3. KEEP IT RELEVANT – As adults, we recognize the value of our time. As children, we were just forced to be in the class. If someone is ignoring my instruction, they either genuinely don’t need the info. or don’t understand the importance of its application. It’s my job to allow them to take some space, or to continue iterating on my explanation. Additionally – be prepared! If participants are dedicating time to learn from you, be courteous and develop a talk track, lesson goals, or practice questions ahead of time.
4. ELEVATE YOUR ENERGY – I truly feel instructors MUST be the most excited person in the room at all times. Even if you’re tired. Even if you’re hungover. Even if you have the flu. If the instructor is low energy, the class will be low energy. Challenge yourself. Remind yourself how the tool enhanced your own career, and try to radiate that positivity.
Michael: Can you tell me three of your favourite Tableau Desktop tips and tricks?
Katie:
Right-click
+ drag (on macOS, left-click+Option+drag) fields, especially
Dimensions, has saved me a ton of time!
I
appreciate the ability to adjust the height, width, x, and y placement of
floating objects on dashboards.
Copy/paste data from the web, Excel,
etc. straight into a Tableau workbooks for a quick prototype of your solution.
Michael: I saw on LinkedIn that you are a Tableau Desktop Certified Professional.
As someone who is currently prepping to take this exam, can you provide
recommendations to my readers on how best to prepare for this exam?
Katie: It looks like we’re in the same boat, Michael. I’ve actually registered to renew my certification this fall. I felt the intimidation factor for the Certified Professional exam came from the fact that it’s judged by a committee. My advice is to focus on the intended audience for the dashboard. Consider device size, accessibility, and tackle all low-hanging fruit. Sharing what others had passed along to me, tackle the dashboard first. In that third module, storytelling, block off only 1 hour and focus your attention on getting the main questions answered. Return to the first and second modules so you can feel confident that you’ve already completed what could be an 8+ hour project. Finally, don’t forget about tooltips! For the second module, advanced technical skills, complete as much of the problem as you can. I like to believe the exam assessors give credit for our thought processes in attempting the solution, even if it isn’t perfect.
Michael: So, like you, I went to a college in the South with
its own particular lifestyle (re: Texas A&M University). Aggies have a lot
of pride, tradition, and love their football. Can you discuss what makes Louisiana State University so special
to you, and maybe also talk a bit about the Cajun lifestyle that is unique to
Louisiana?
Katie: The Cajun atmosphere in South Louisiana is centered on family, tradition, and amazing food. Our ancestors weren’t wealthy, so they relied on heavily spiced meats and lengthy cooking times to ensure a delicious meal. It’s not uncommon to find a few people from Acadiana spending an entire Saturday cooking a “sauce”, playing cards, and drinking 10 oz. cans of domestic beer. I think many of us continue to pass along the games, phrases, and recipes of the Cajuns because we want our friends and future families to have as much fun as we always have! LSU Sports, and especially football, are just another piece of that puzzle. The campus is simply electric on game-day; it’s tough not to be excited. When The Golden Band from Tigerland marches down the hill, it brings back the exhilaration and nostalgia I’ve experience my entire life. I love that tailgating is always a nice excuse to see old friends and meet new ones. Academically and socially, LSU has given so much to me. It only feels right to share those experiences with the ones I love.
Michael: What is next on your “To Do” list? What can the
Tableau community expect to see from you in the near future?
Katie: My husband and I chat frequently about our journey to Financial Independence. As we leverage Tableau in these decisions, I’m hoping to find better ways to share the information with our community. Money is always a tricky topic, but my hope is that, in sharing our story, we might motivate others to think analytically about their financial futures. In the meantime, I’ll continue creating vizzes that help in my everyday life. I’m currently tracking sitting/standing hours at my desk each day to find patterns. I’m also attending a big trip to Europe next year that lends itself quite nicely to a beautiful dashboard. My hope is that I can continue teaching, sharing with, and learning from the community that has given so much to me! I’m so honored by the opportunity you’ve provided to share my story. Thanks, Michael, and for everything you do for our community.
This was tweeted today by Kris Curtis (@CurtyCanViz). Thought I would share as food for thought.
Today’s facepalm moment. So where do you draw the line at number of filters available on a dashboard? I’m like 4 or 5. Had someone come to me with a dashboard with 37 filters on it! Suggestions/advice to stop this type of behavior please #datafam#dataviz
Kris Curtis
My Friend, Mark Bradbourne, responded with this.
Show them these two images, and ask them how much training is required for each. Car vs. Space Shuttle. We want users to easily engage with our data… no time for overly complex UI
Here are the
steps to add an image to a Tableau Project on a Tableau Server.
As a Server or Site Administrator, bring up the Tableau site in a browser (preferably using Google Chrome).
Click on a Tableau project (in the example below, I clicked on Information Technology).
In the Tableau Project, Click on the Details icon (re: lower case ‘I’ in a circle). See screenshot below.
In the Tableau Project Details, click on the Edit button. We want to add the HTML code to include the image. See screenshot below.
In the Tableau Project Details About text box, enter the following code:
!<Server URL>/<Image Name>!
Note: I recommend you do not have any spaces in
the image name. In the example in the screenshot below, I use underscores
instead of spaces. Also, I prefer to use .PNG files, but also used a few .JPG
files. I cannot guarantee any of the other file types (e.g., .GIF) will work.
The
images must be put in the htdocs folder. Here is the absolute
path to the htdocs folder and a screenshot of some images I used.
I had a lot of different directions I wanted to go with this, and could not decide. I looked at several other entries and liked Eva Murray’s chart. I tweaked and incorporated her chart into my entry. Here is a link to Eva’s discussion of her entry.
I also give Eva attribution at the bottom of my data visualization.
Thats all for this week! Whew! What a week. And it is only Tuesday!